Summarizing Your Data

When data are queried in Stipa Cloud, they are displayed in so-called "long" format. Although this format is useful for reviewing data from multiple projects and forms, it can be difficult to interpret.
Summary tables provide a more user-friendly option for displaying data. Summary tables can also be used to derive summary statistics from, and perform operations on, your data. The downside of a summary table is that it can only be used to display data for a single Form of a single data collection Project.
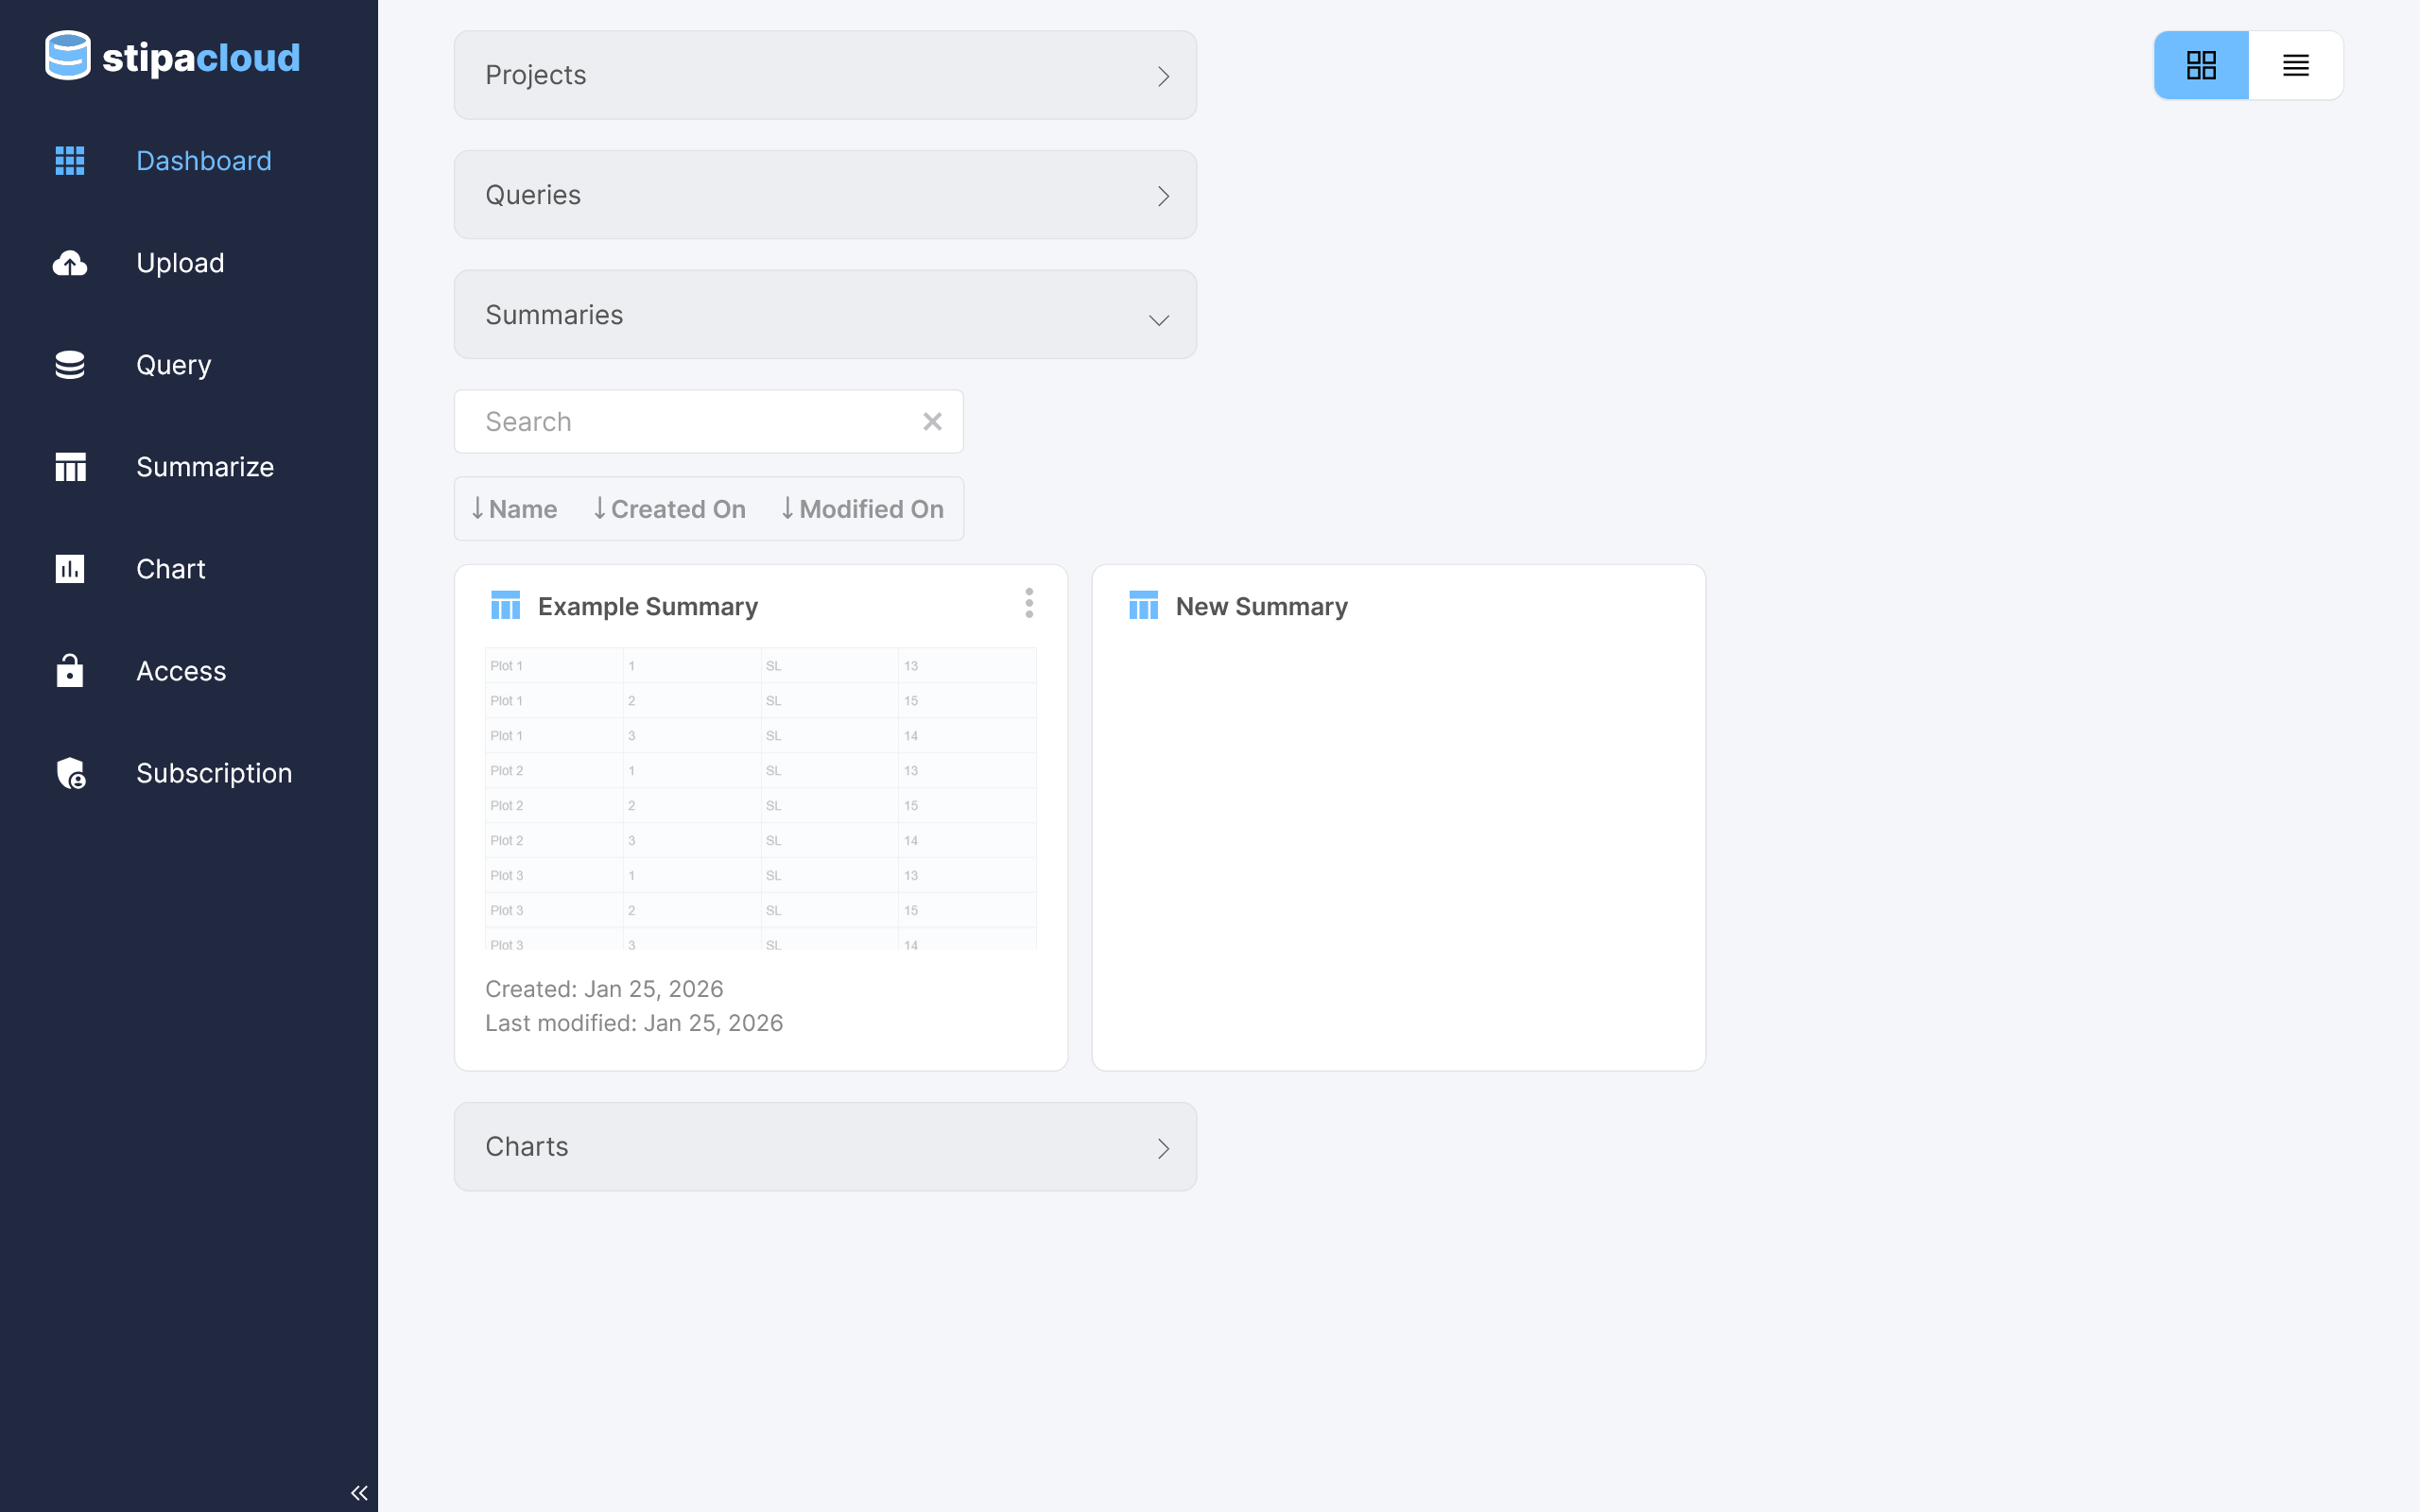
After logging in to the dashboard page, navigate to the Summarize view by selecting the appropriate tab from the menu on the left side of the screen.
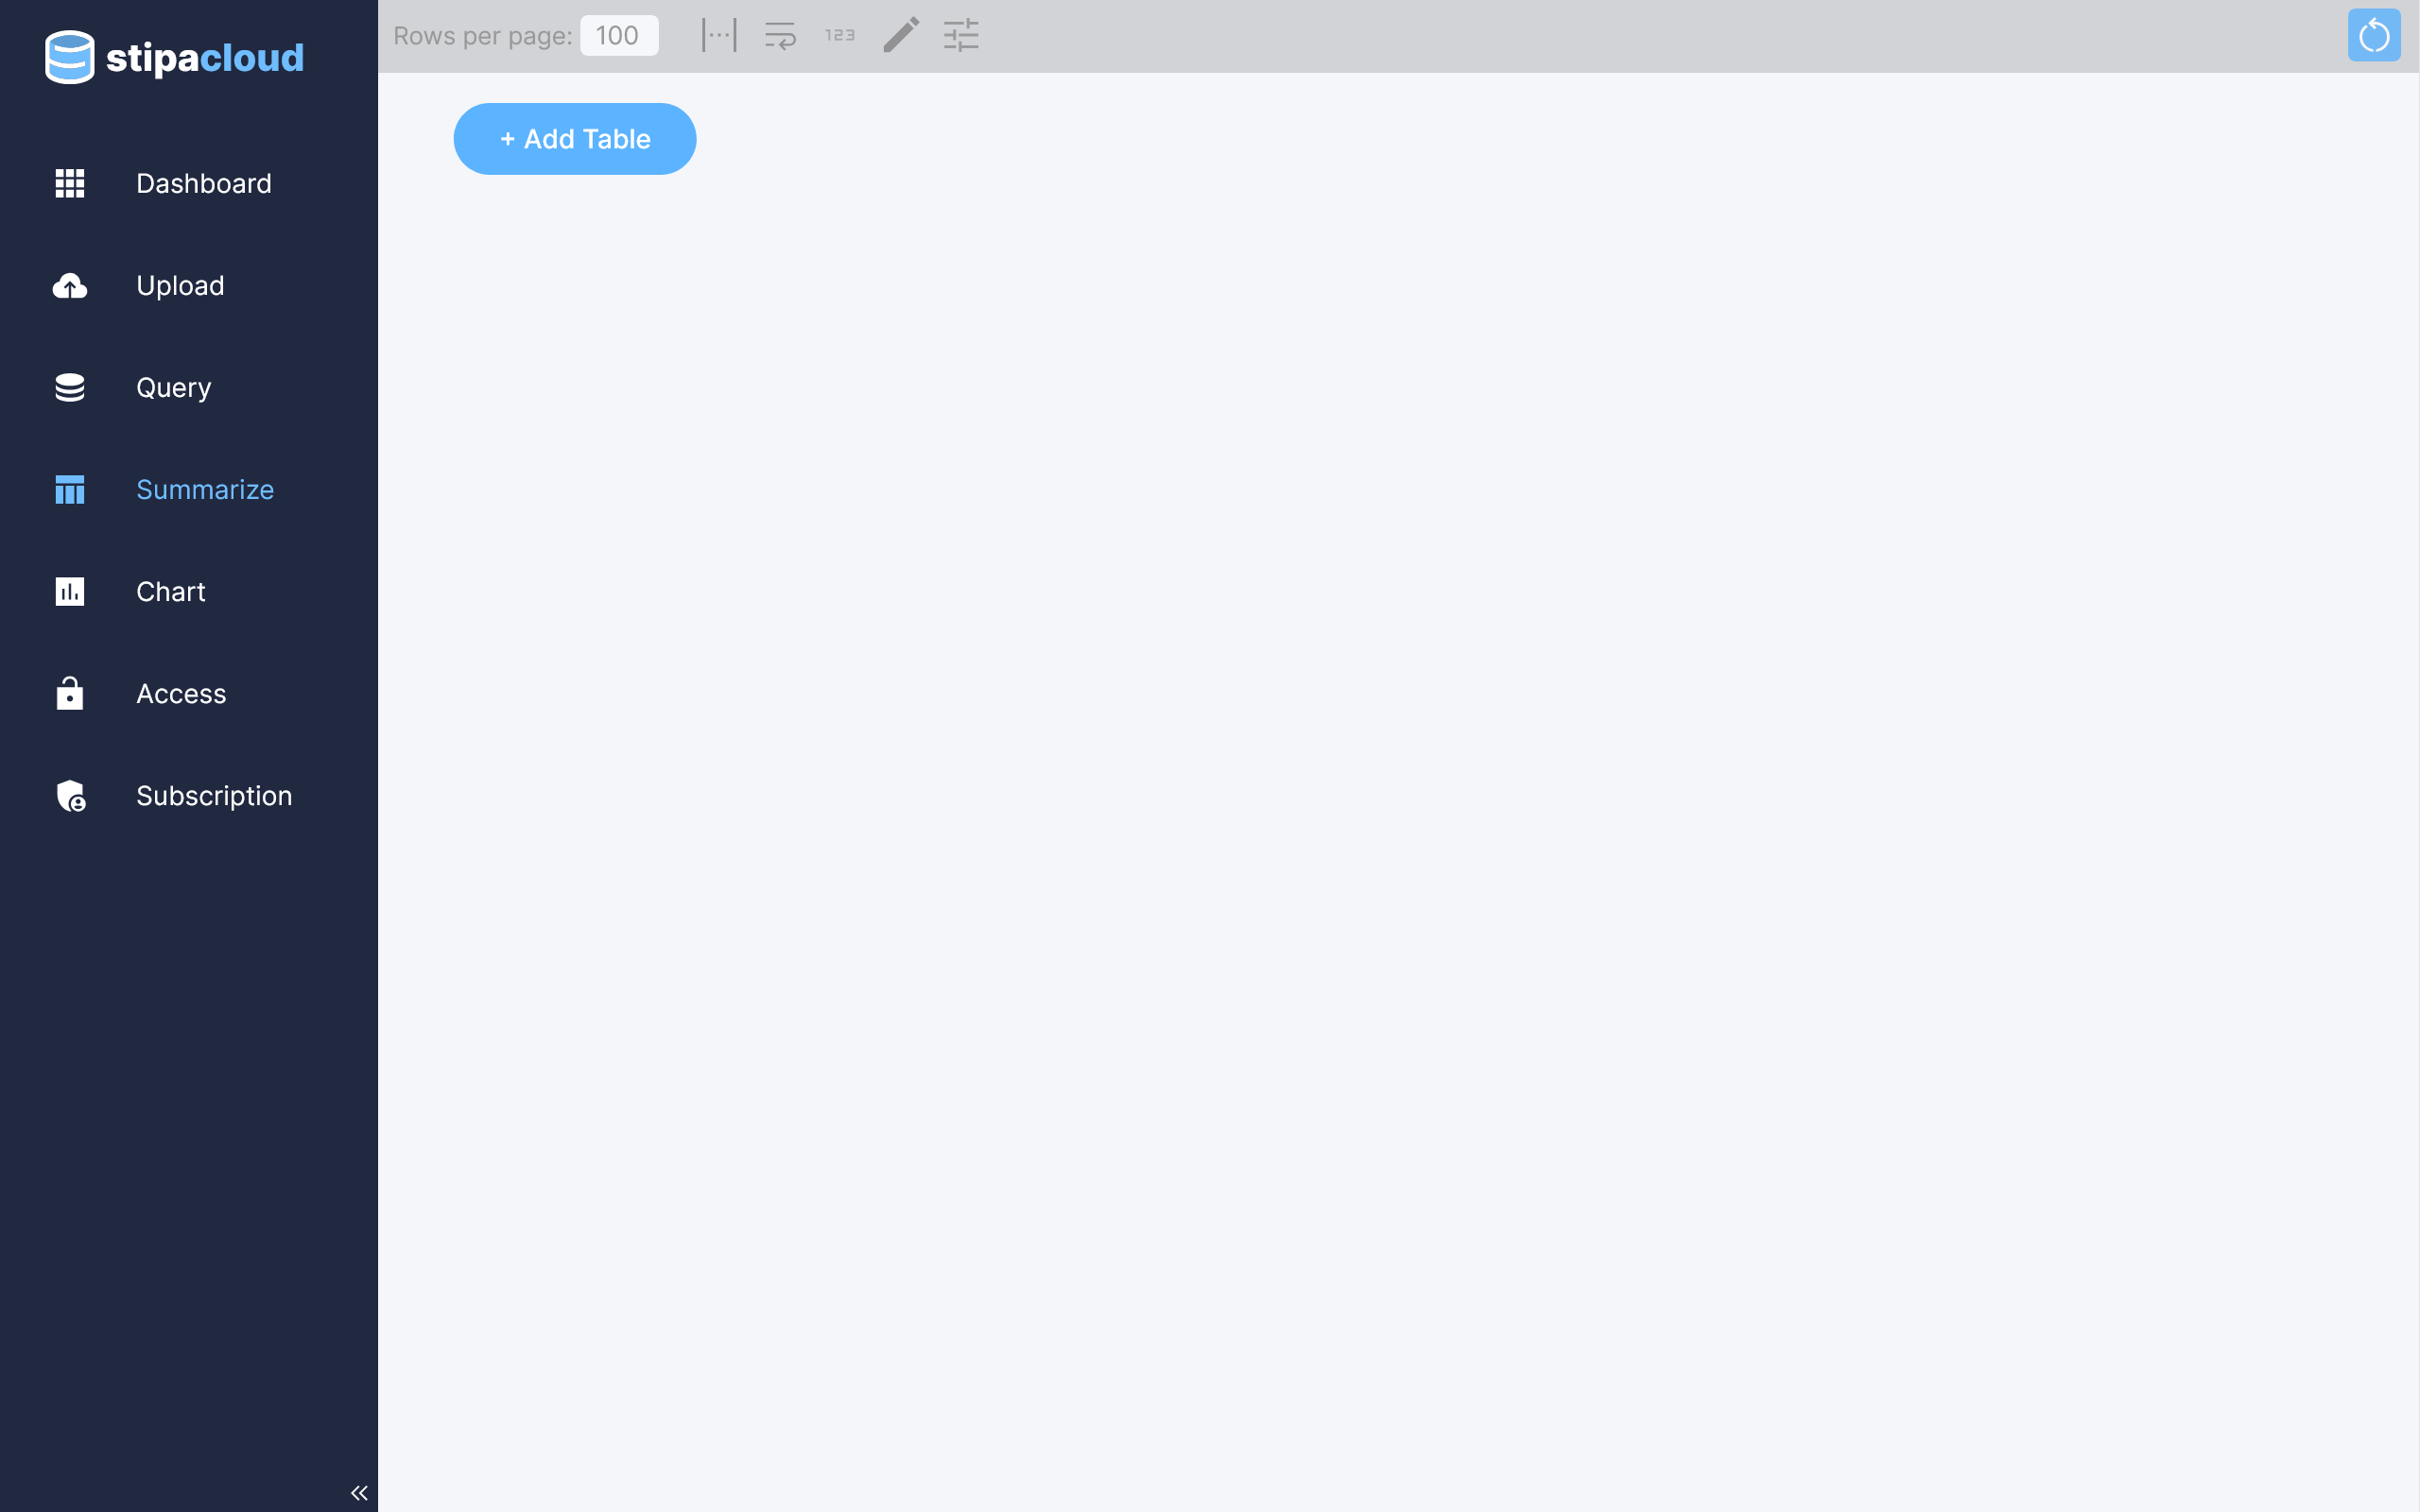
Figure 1. Summarize view.
Click on the Add Table button to open a toolbar for creating a new summary table. You can also open the toolbar by clicking on the Toggle Settings button at the top of the view.
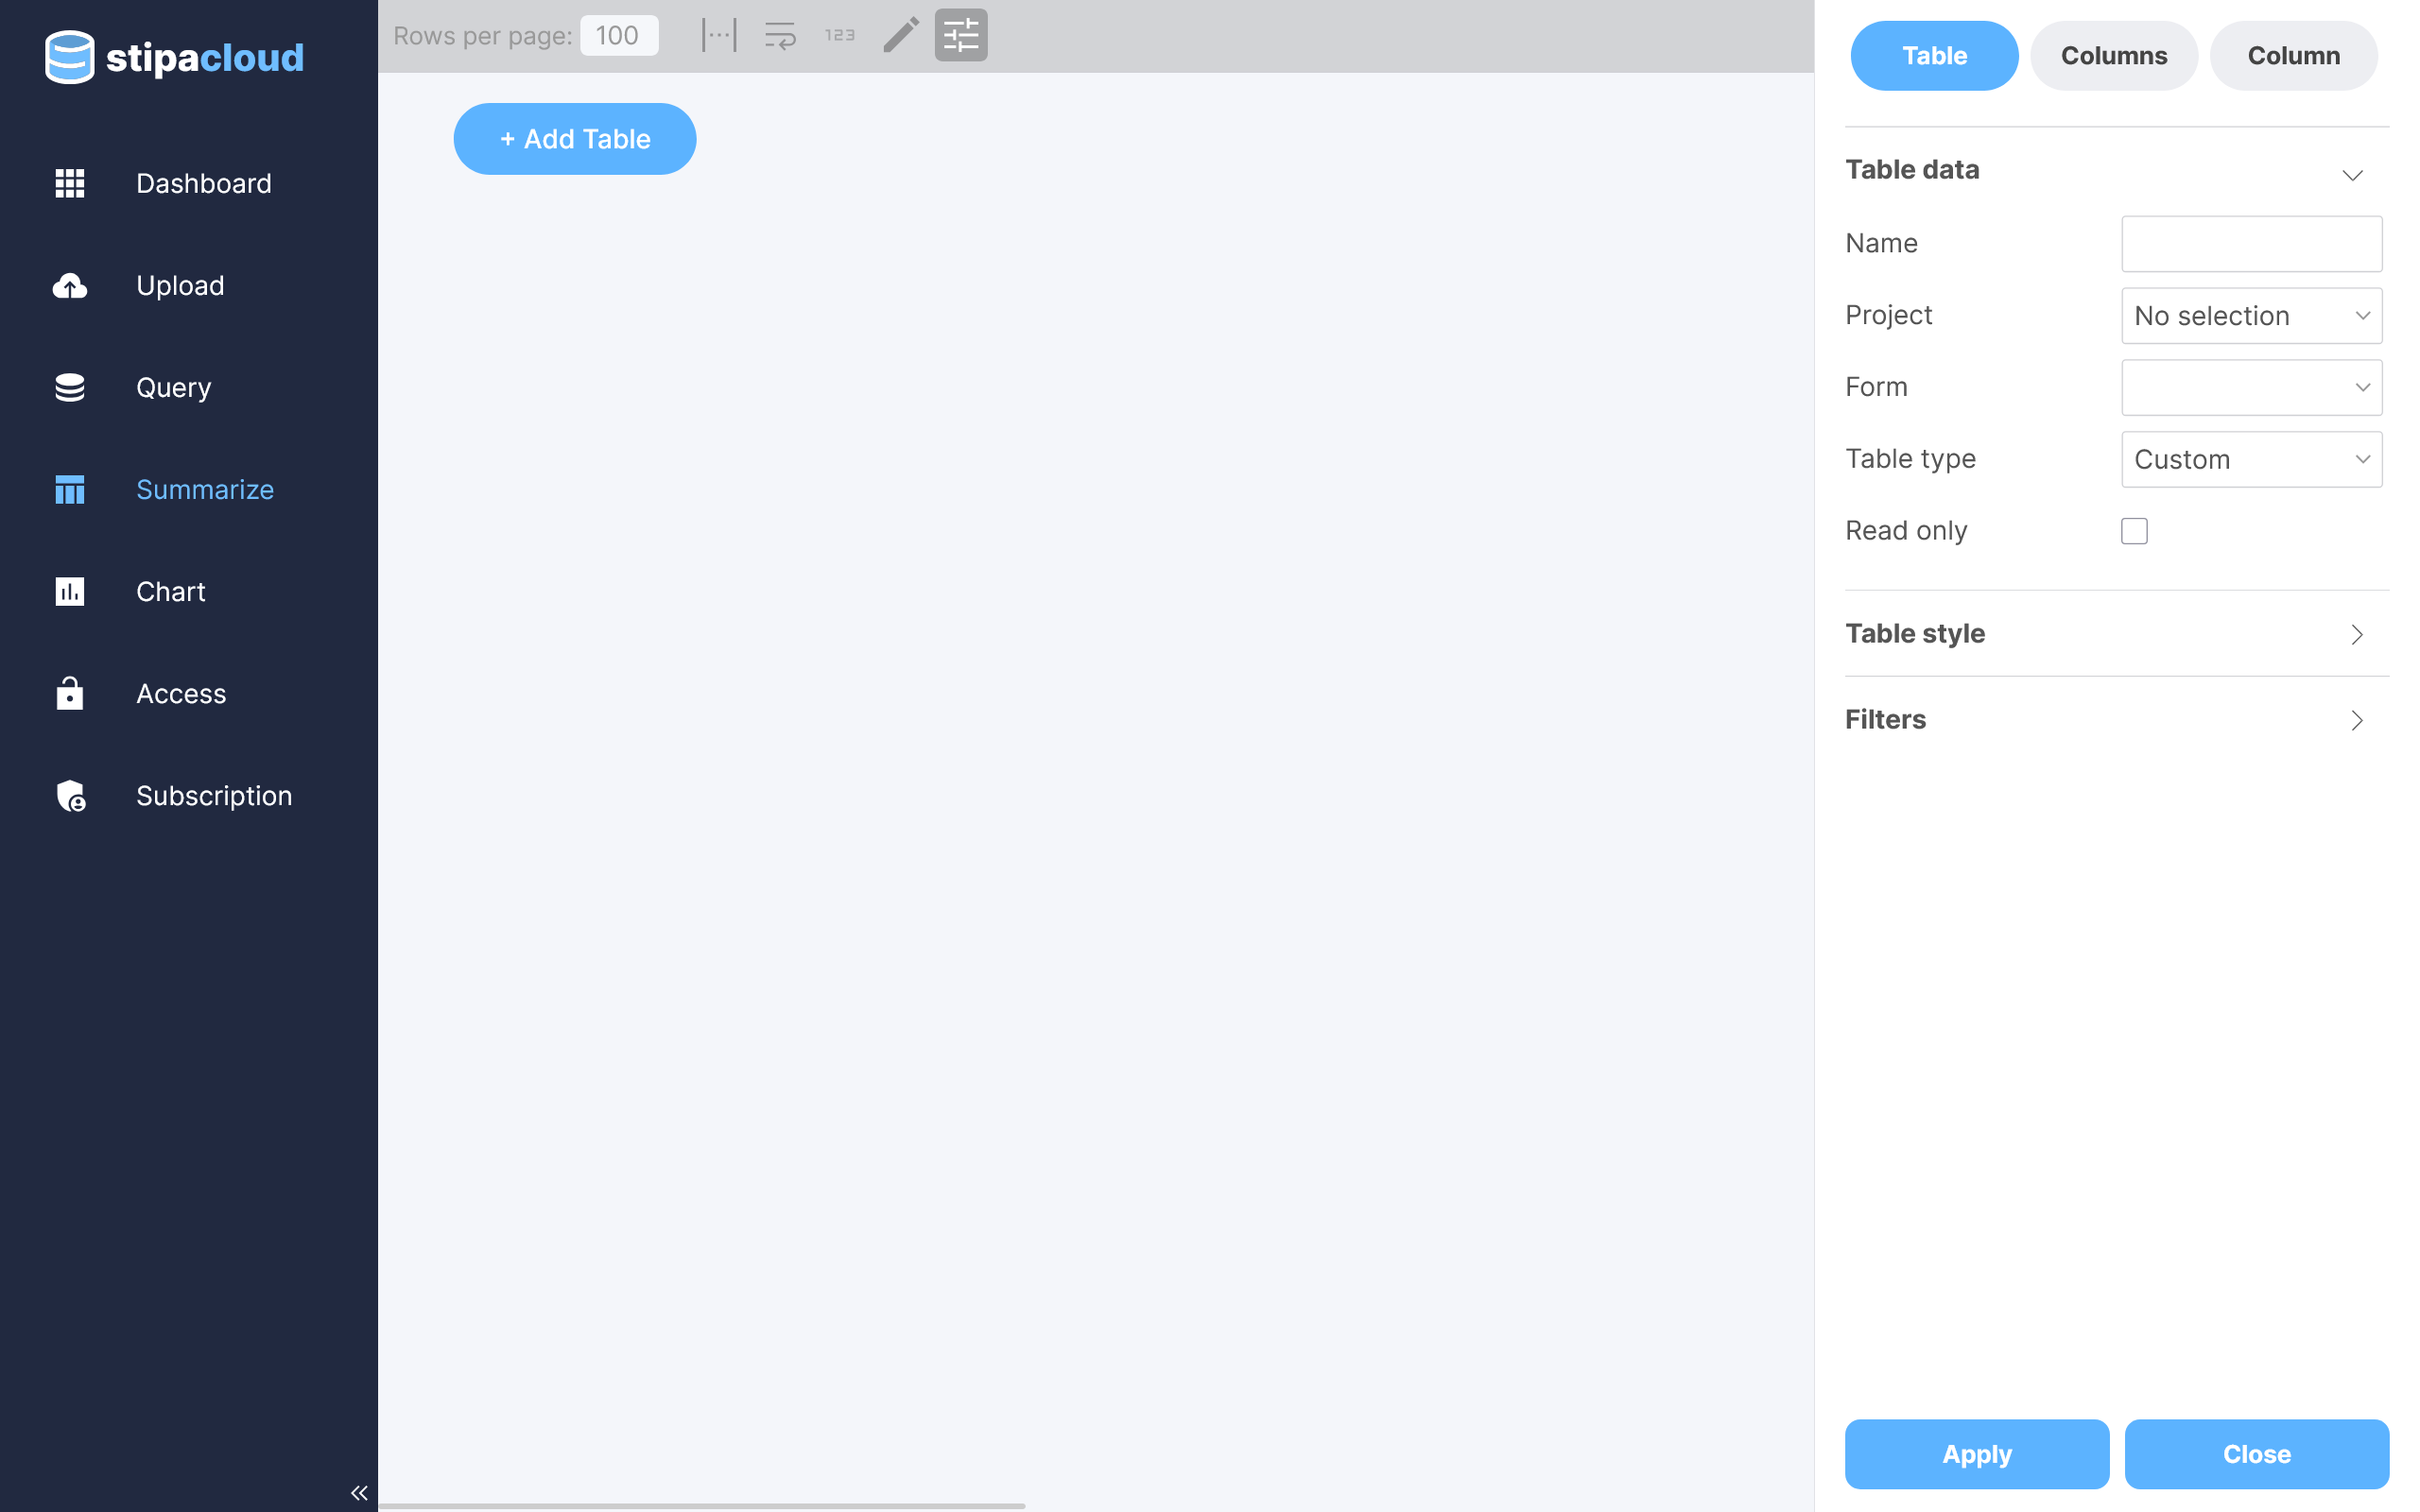
Figure 2. Editing summary settings.
Click on the Table tab at the top of the toolbar and select the Project and Form you wish to summarize. Select the type of summary table you wish to create and click Apply to load the table into view. Five types of tables are supported: Wide, Pivot, Count, Occurrence, and Custom.
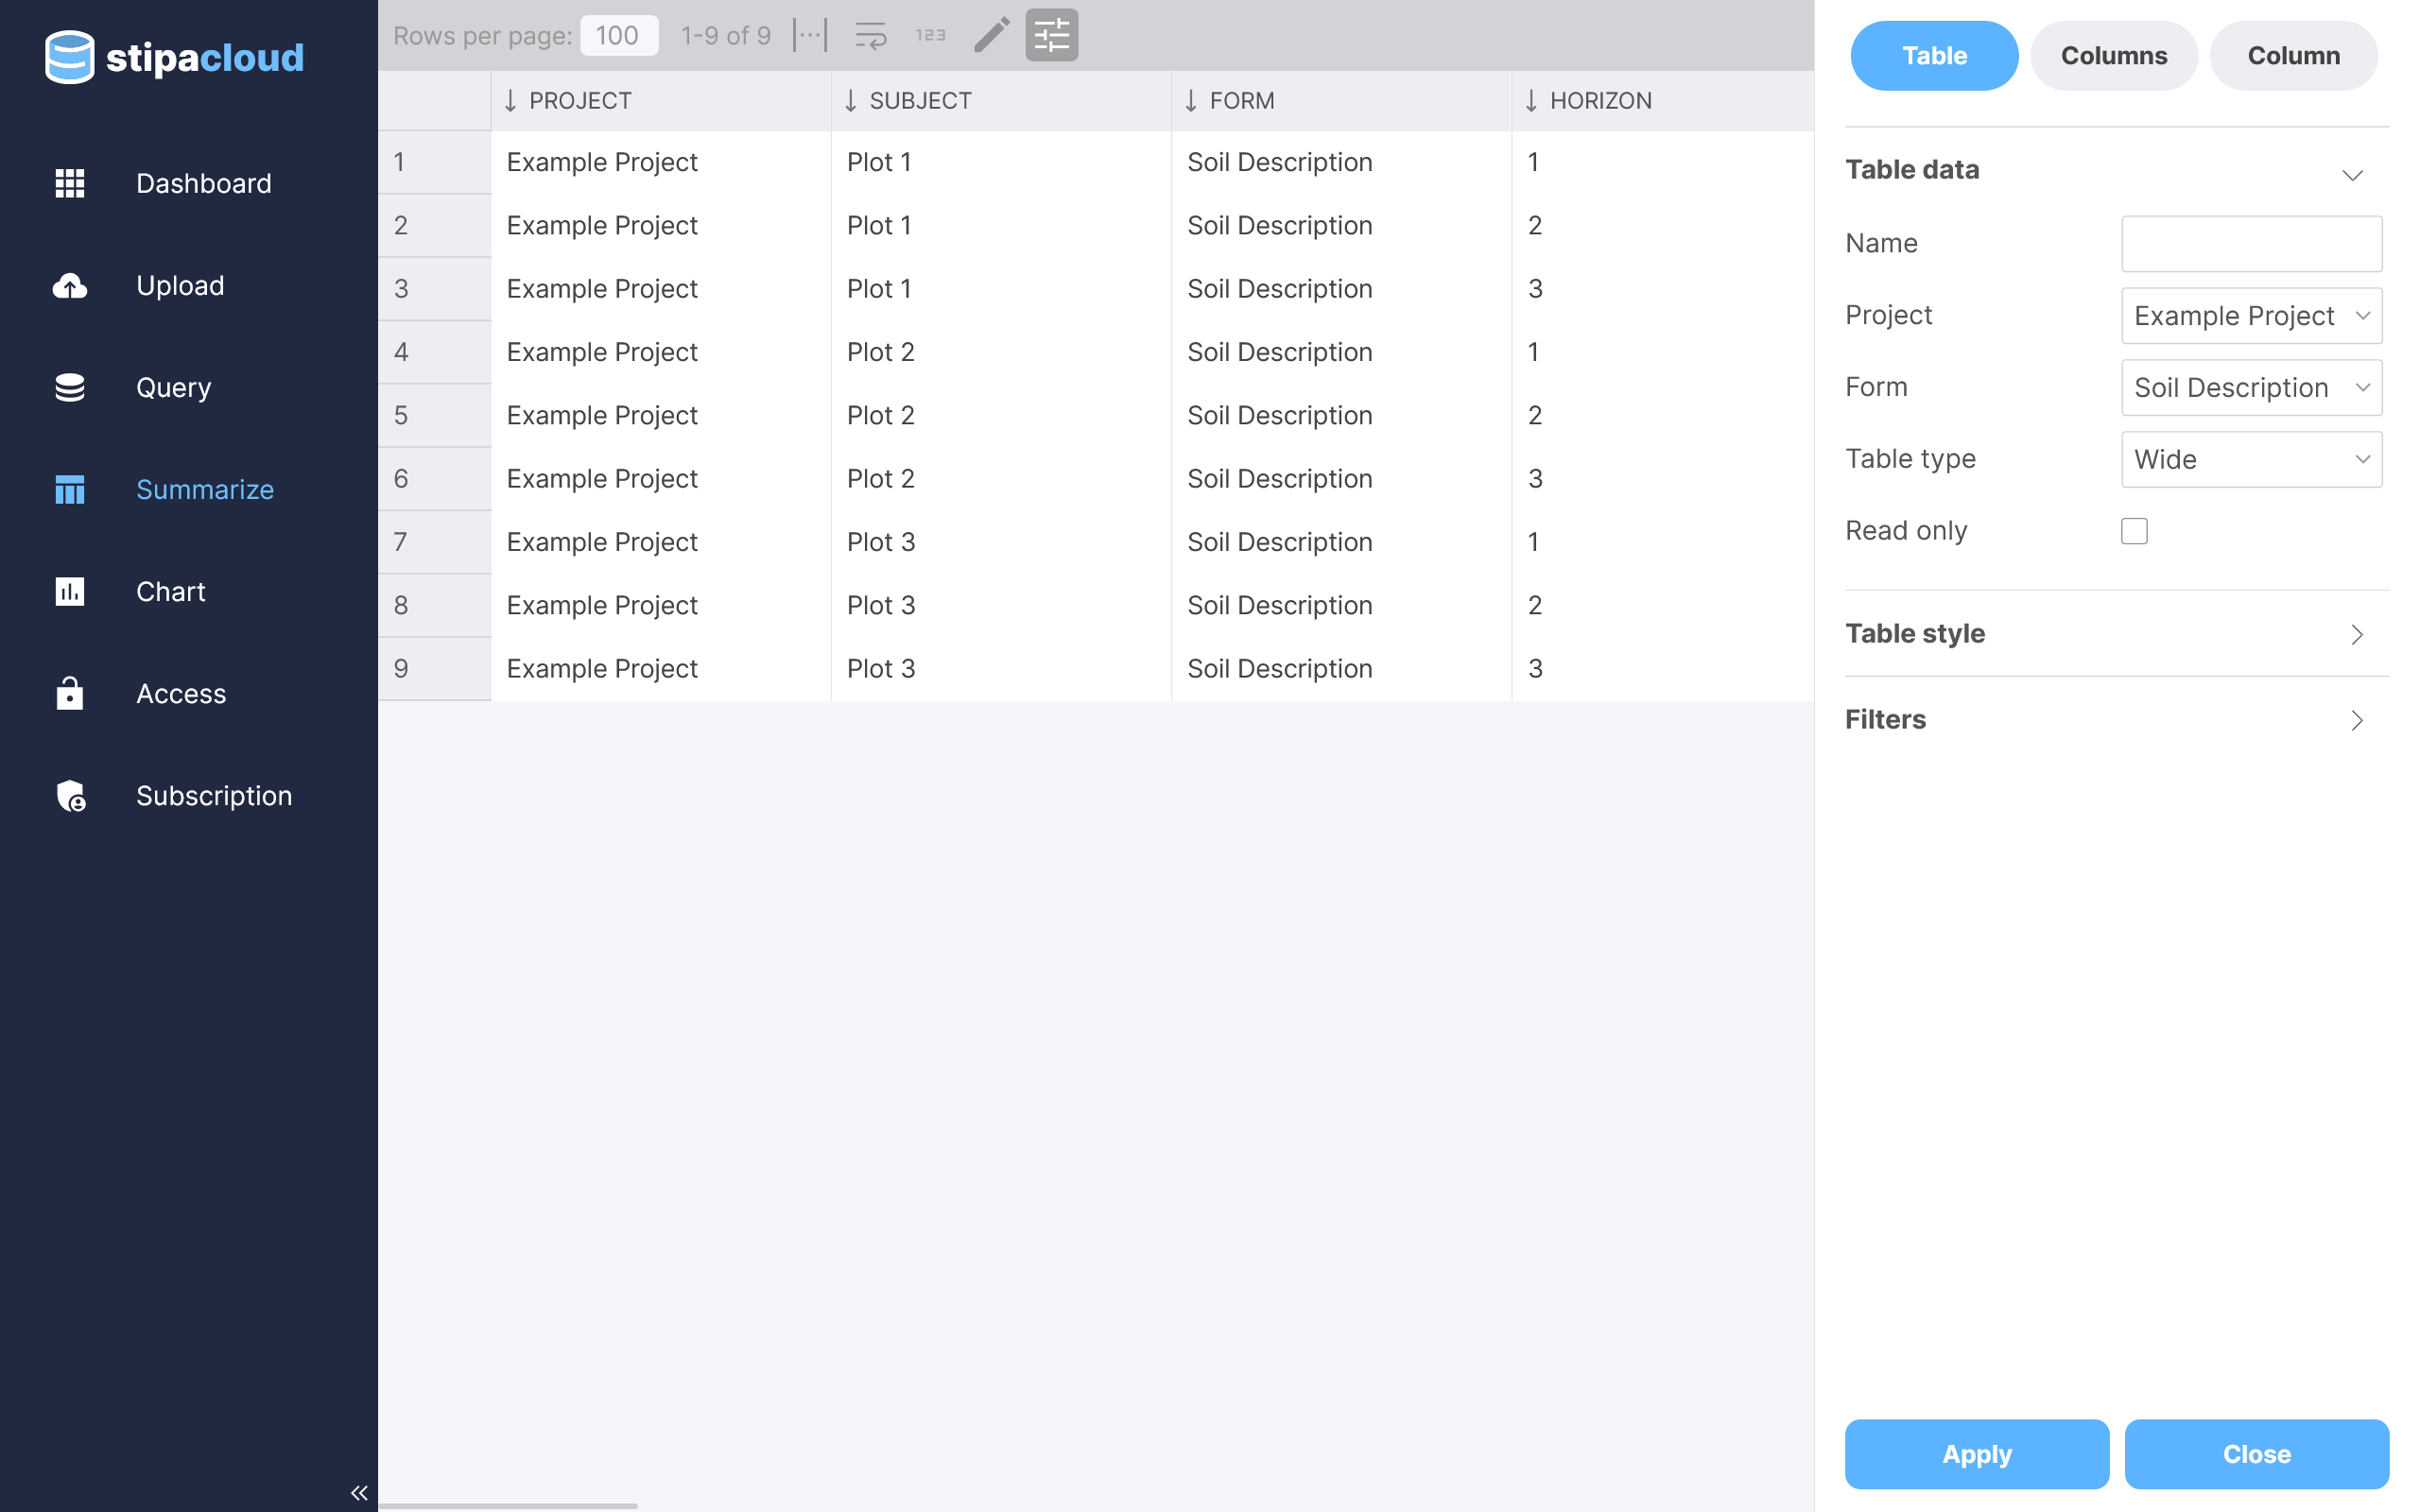
Figure 3. Specifying project, form, and table type.
A Wide table includes a row for each data entry and a column for each Attribute value. Columns for the associated Project, Subject, Form, and/or Observation are also included by default. Note in the illustration below how columns widths have been resized to fit their content using the Auto Fit Content button at the top of the table.
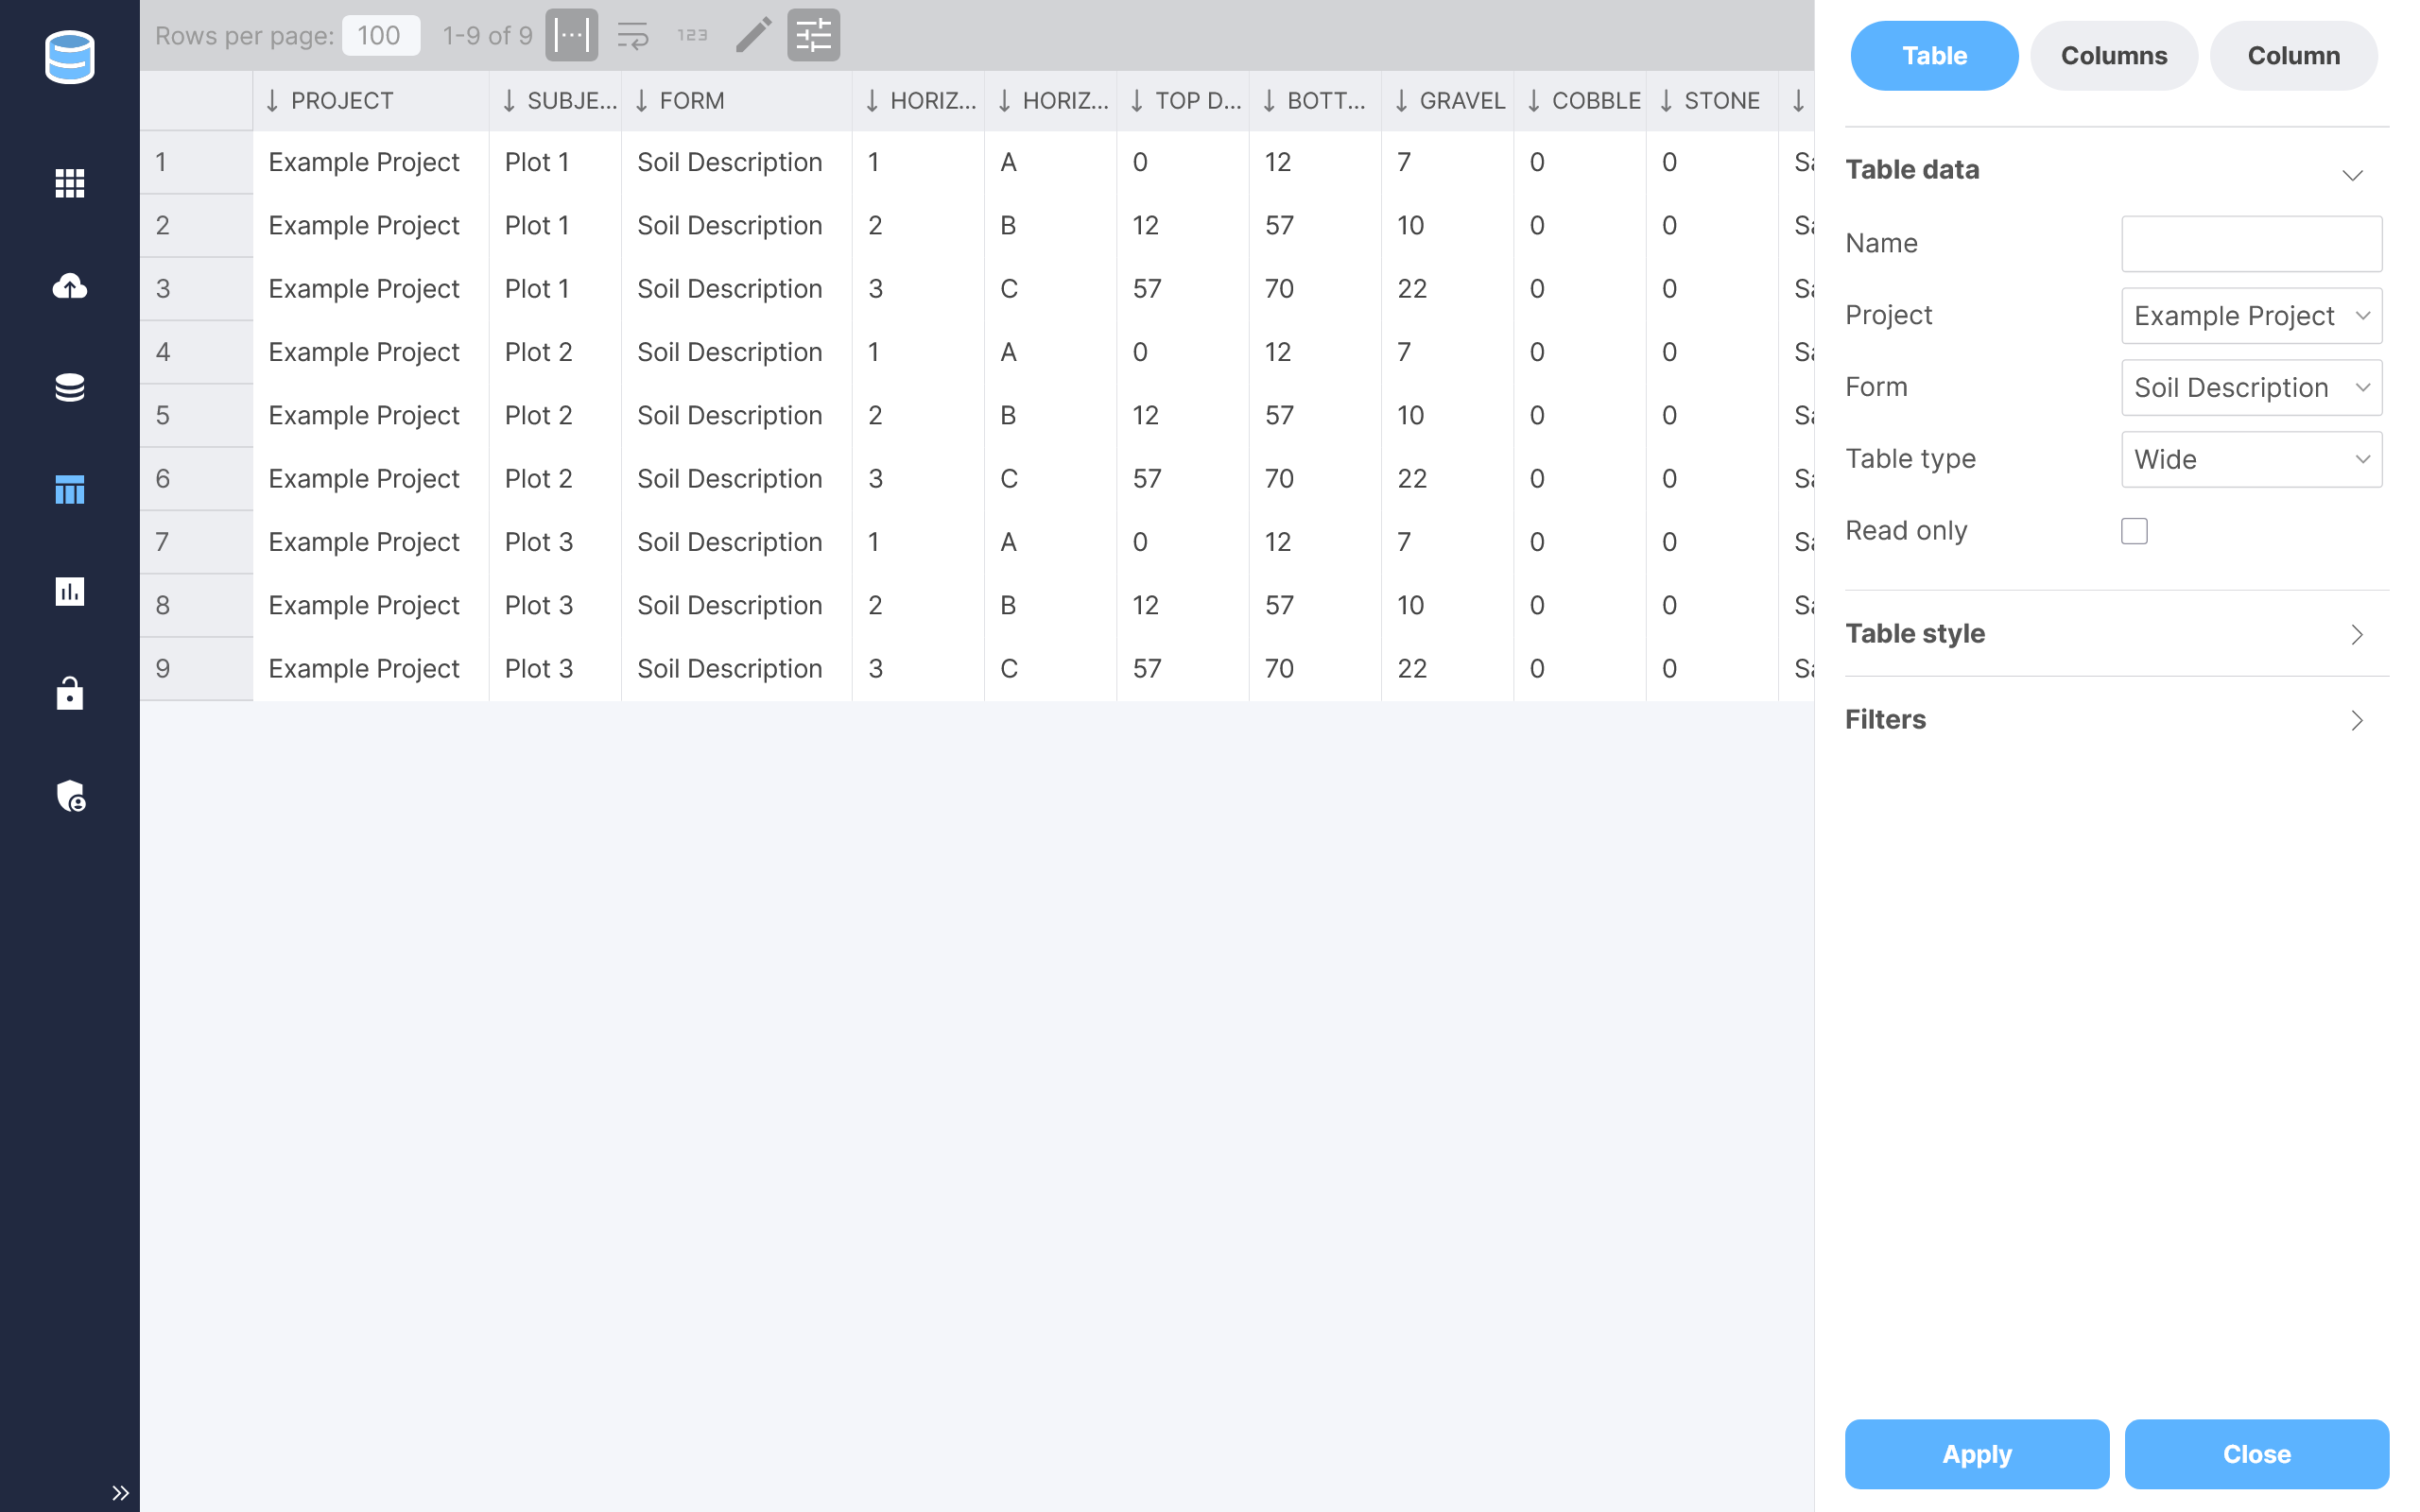
Figure 4. Creating a wide table.
A Pivot table has a similar structure to the Wide table, except that data column values are aggregated across selected group columns (Project, Subject, Form, and/or Observation) using the selected aggregation function. Values are summed by default. Only those data columns having a numeric data type are included in the Pivot table.
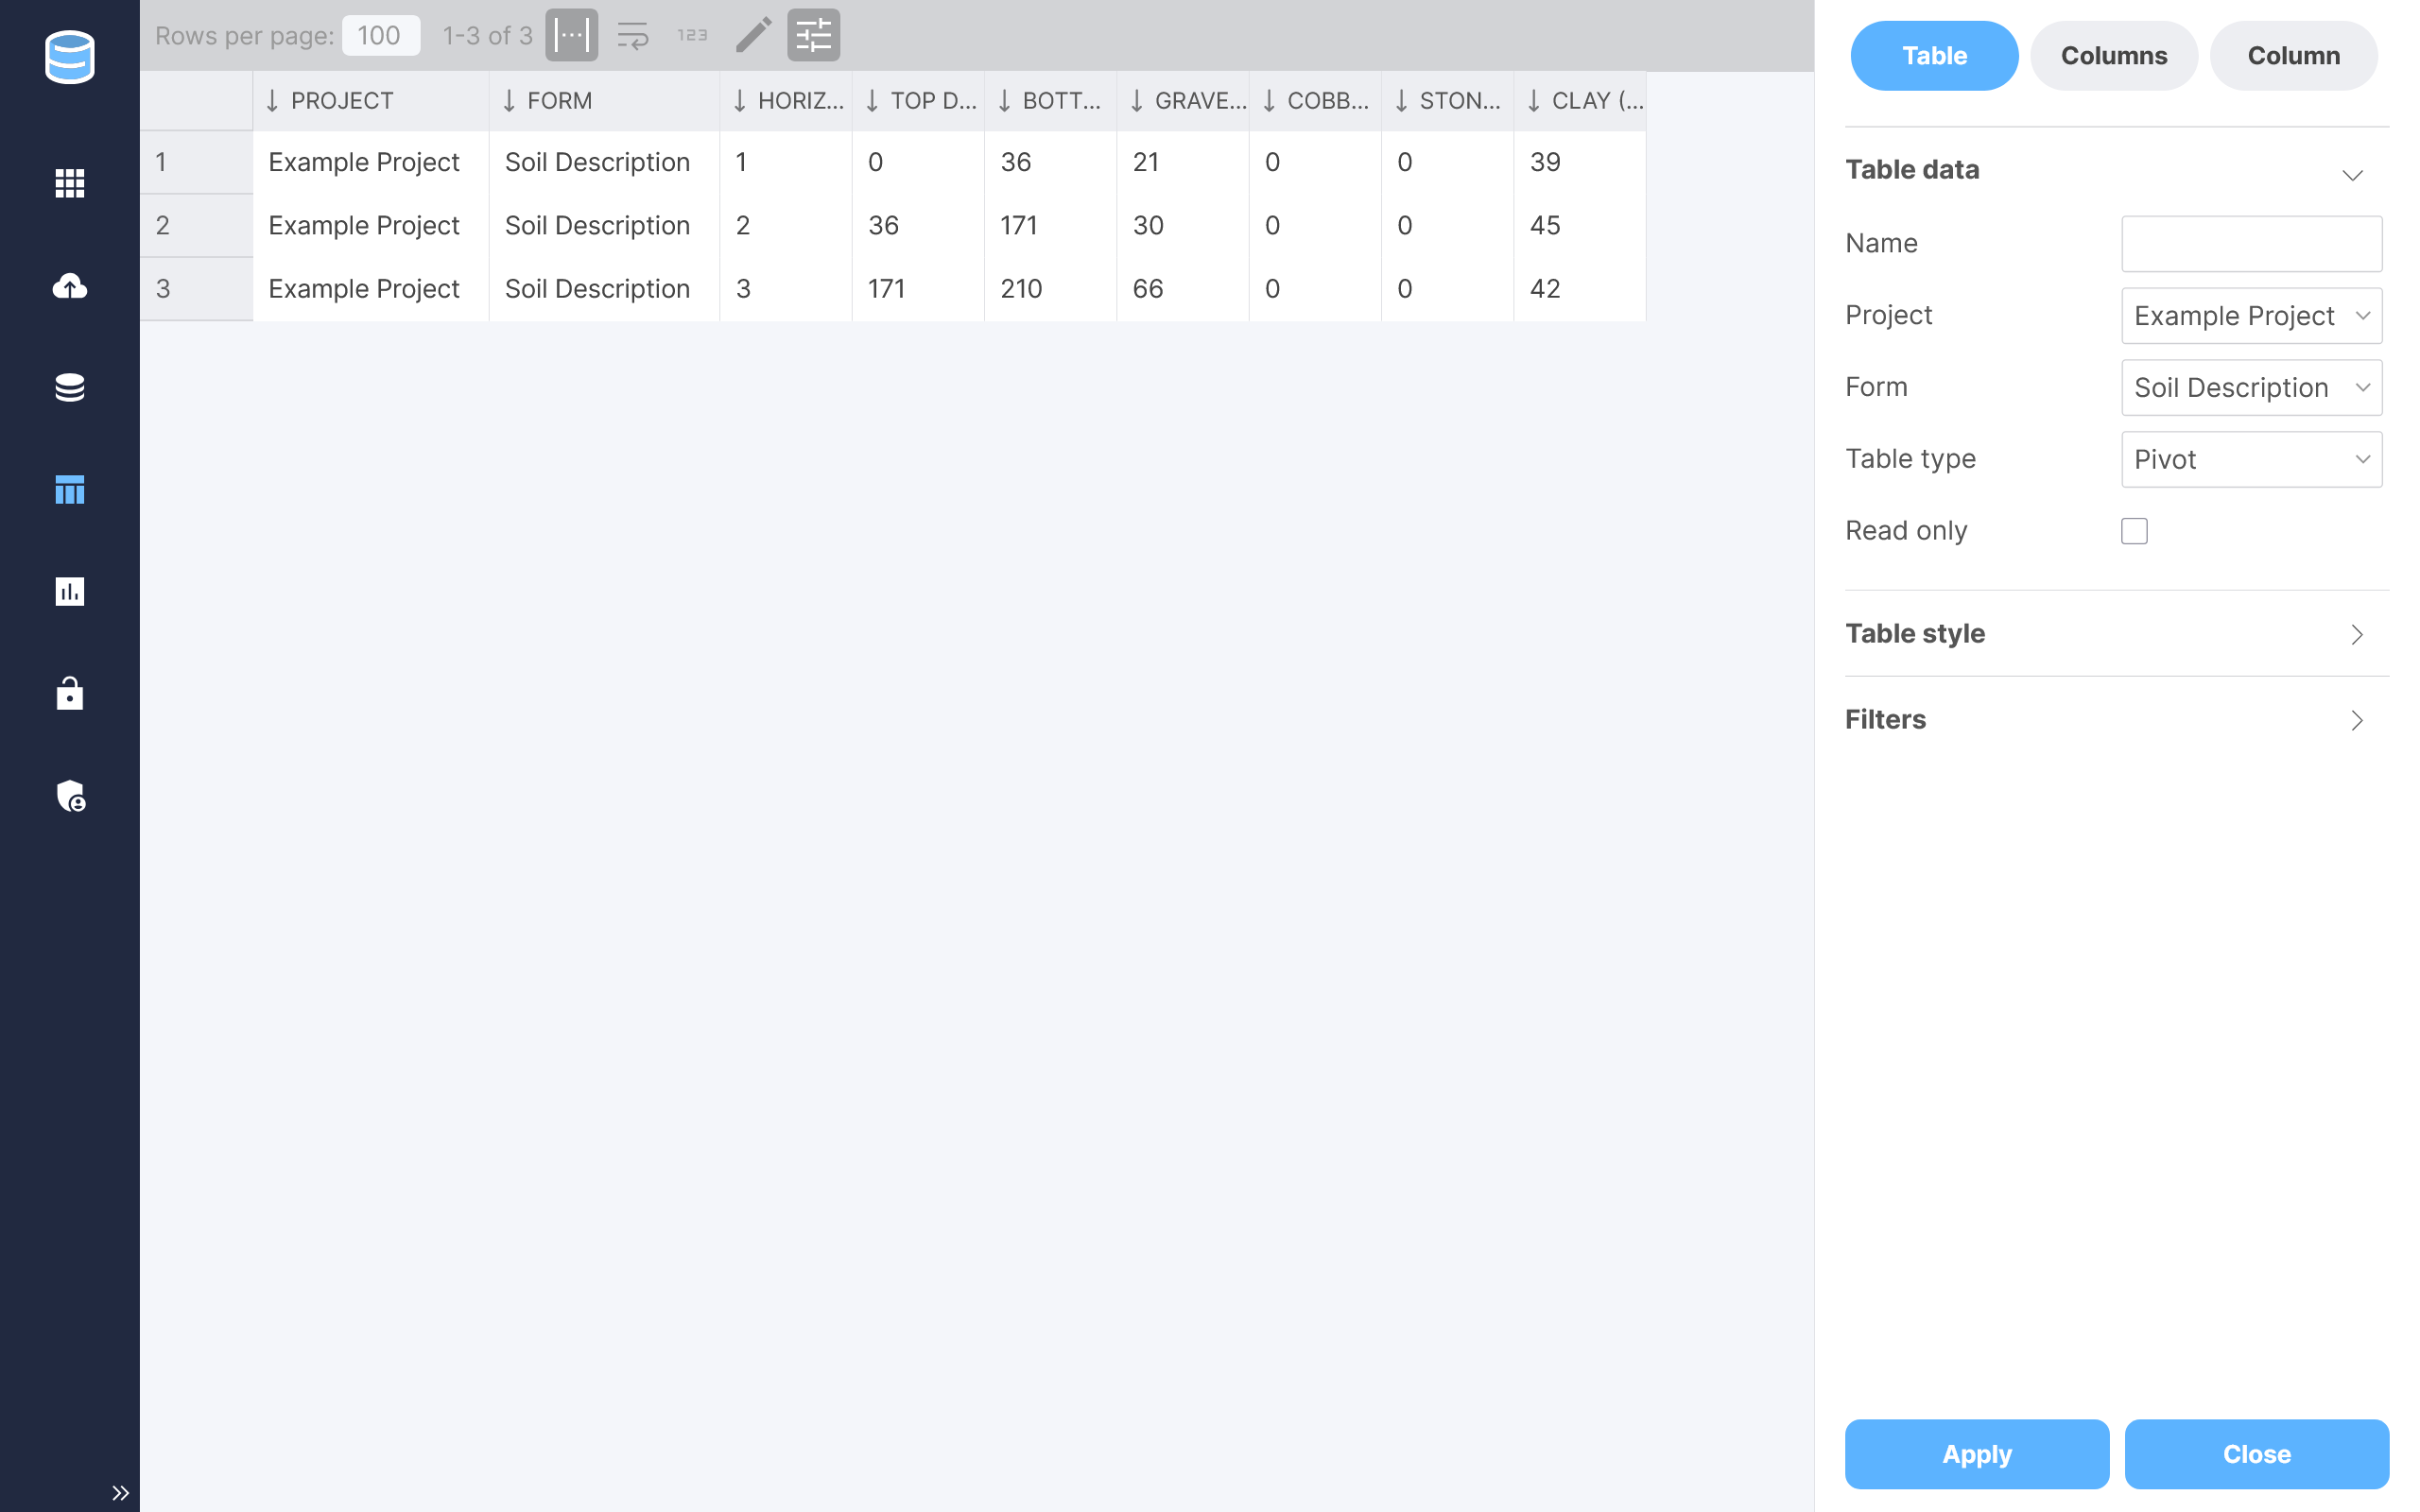
Figure 5. Creating a pivot table.
A Count table displays the number of times a particular categorical attribute value occurs across selected group columns.
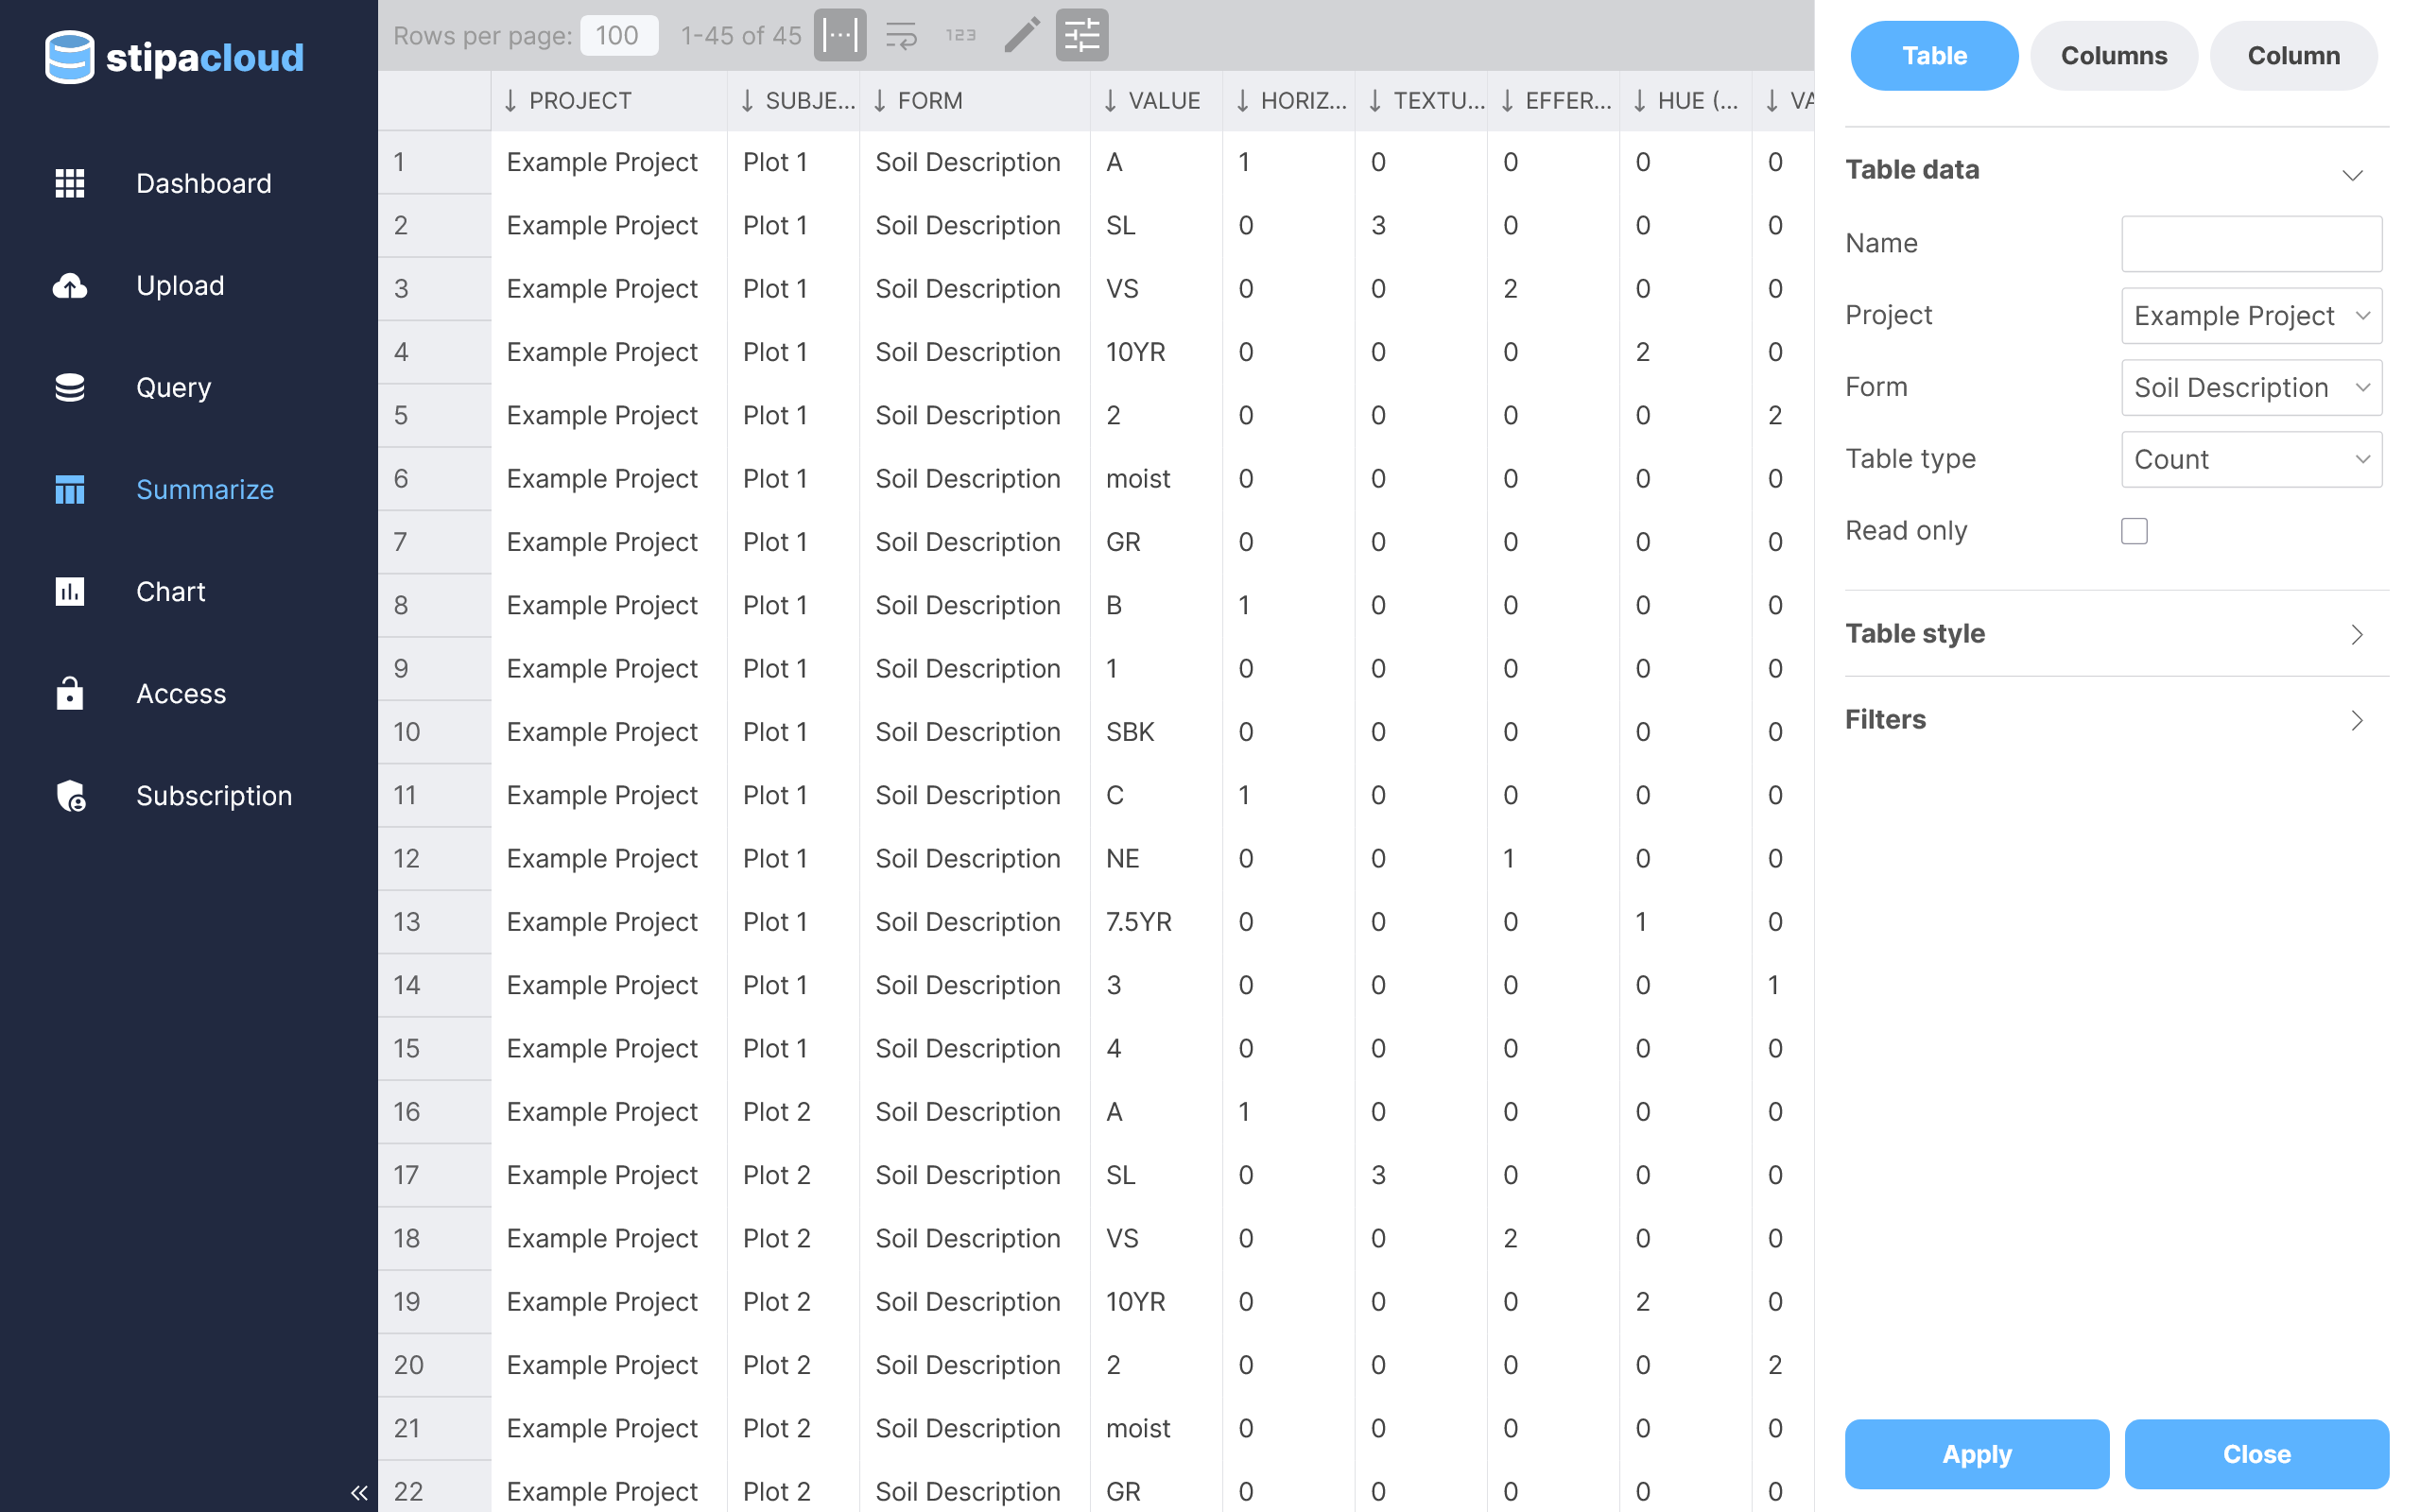
Figure 6. Creating a count table.
An Occurrence table displays the number of times a particular categorical attribute value occurs at least once across selected group columns.
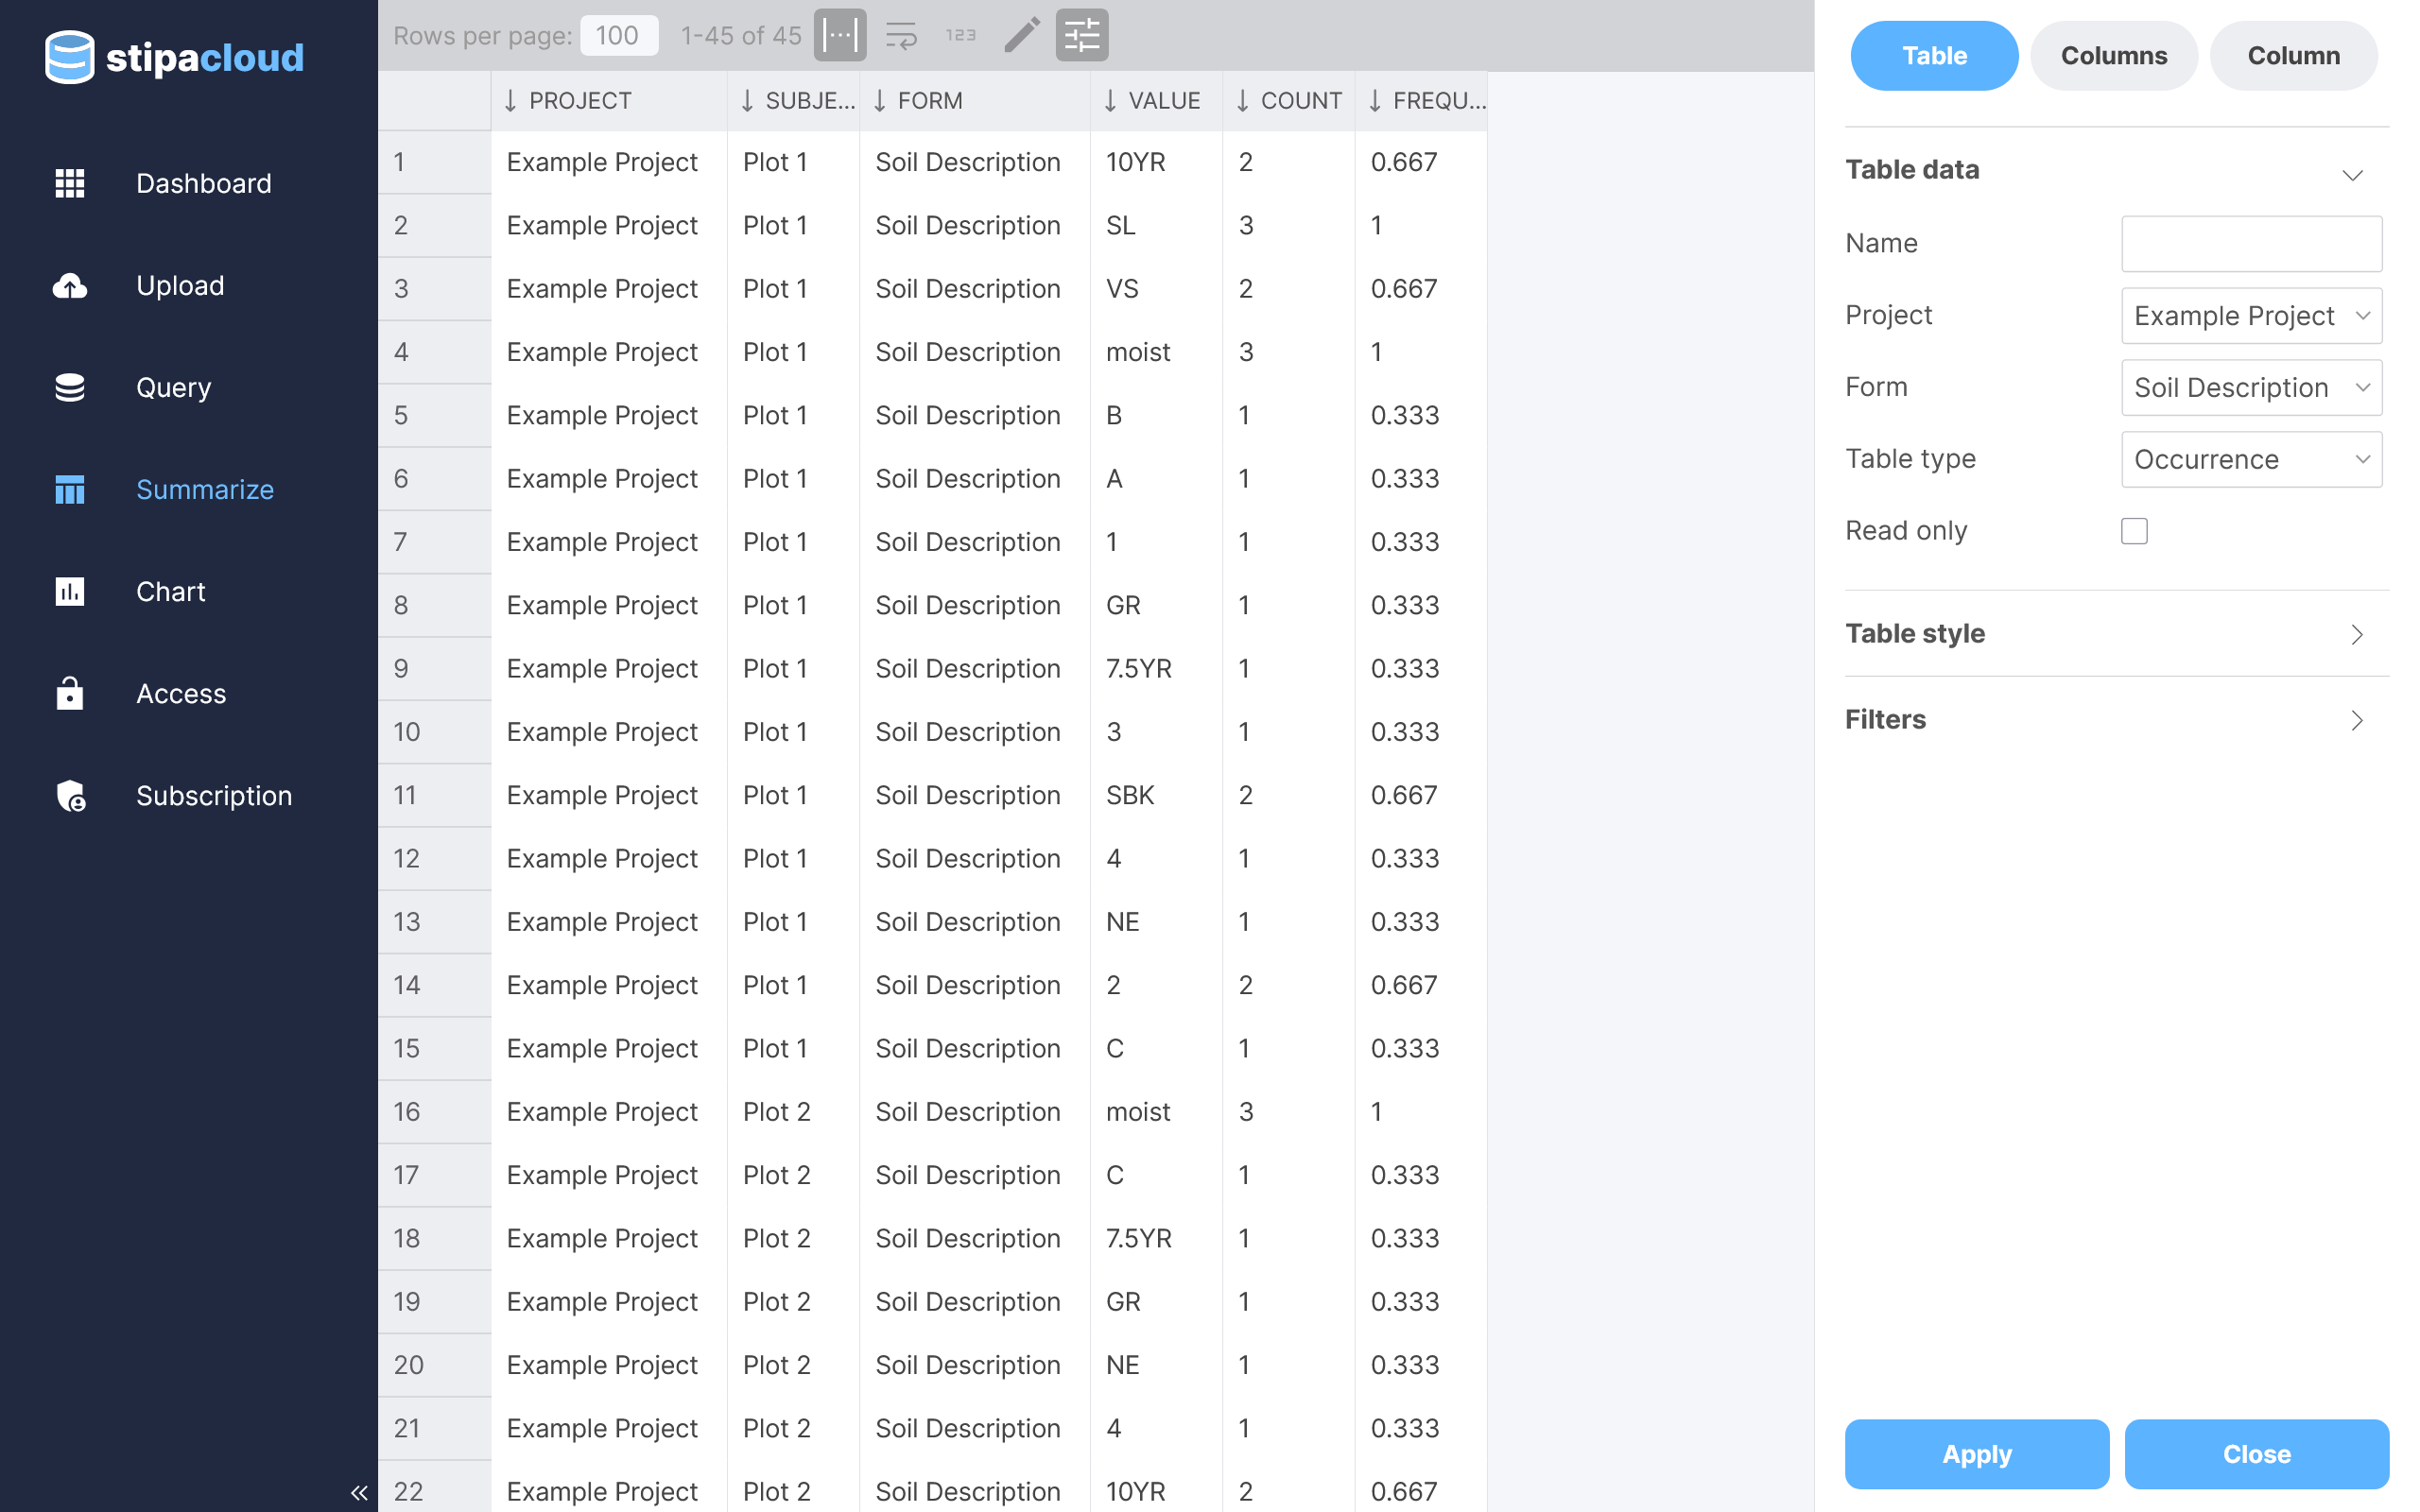
Figure 7. Creating an occurrence table.
A Custom table allows you to specify any combination of group and data columns, as well apply various expressions to the data.
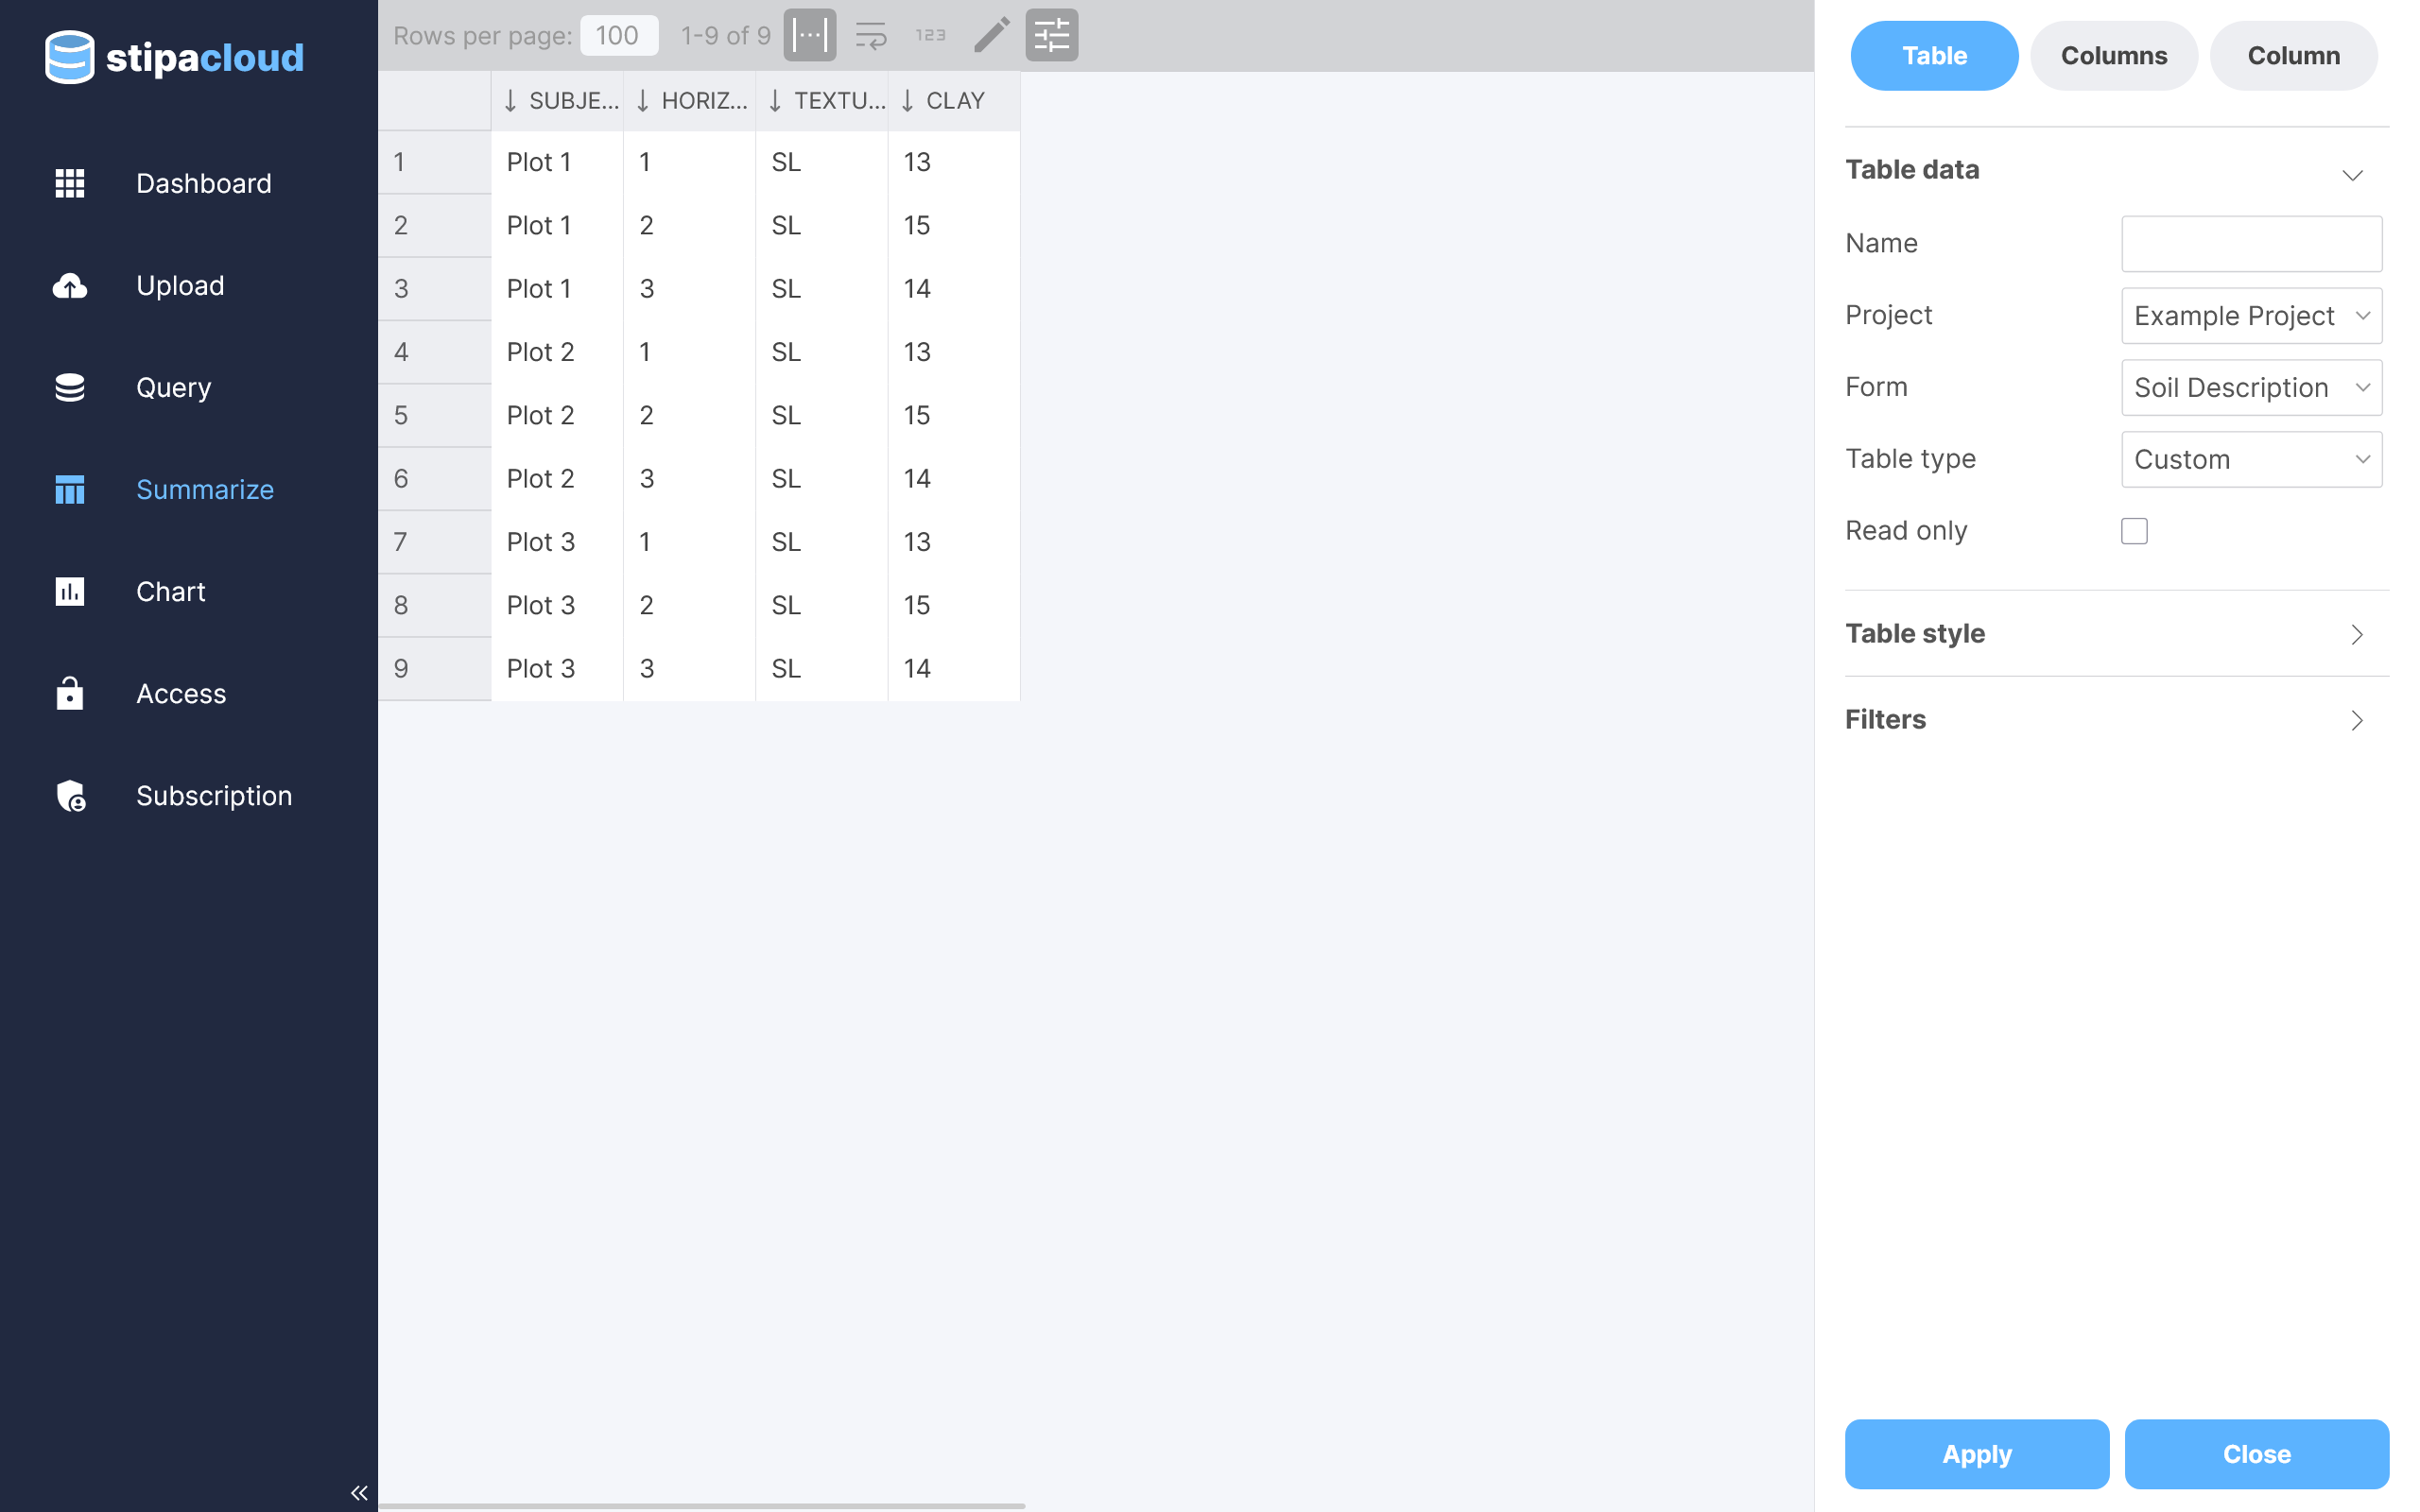
Figure 8. Creating a custom table.
Click on the Columns tab at the top of the settings toolbar to manage which columns are included in the table. The menu at the top of this panel contains the three general types of columns you can add to the table: group, data, and expression. Click on the desired menu option to add that column type to the table.
The bottom menu contains all of the columns you have added. Relevant columns will be automatically added to this menu when a new type of table is selected. Click on a menu option to edit the properties of that column. Remove a column by dragging the menu option back to the top menu. Change column order by dragging a menu option left or right. View the name of an added column by hovering over the menu option.
Click the Apply button at any time to update the table with your changes.
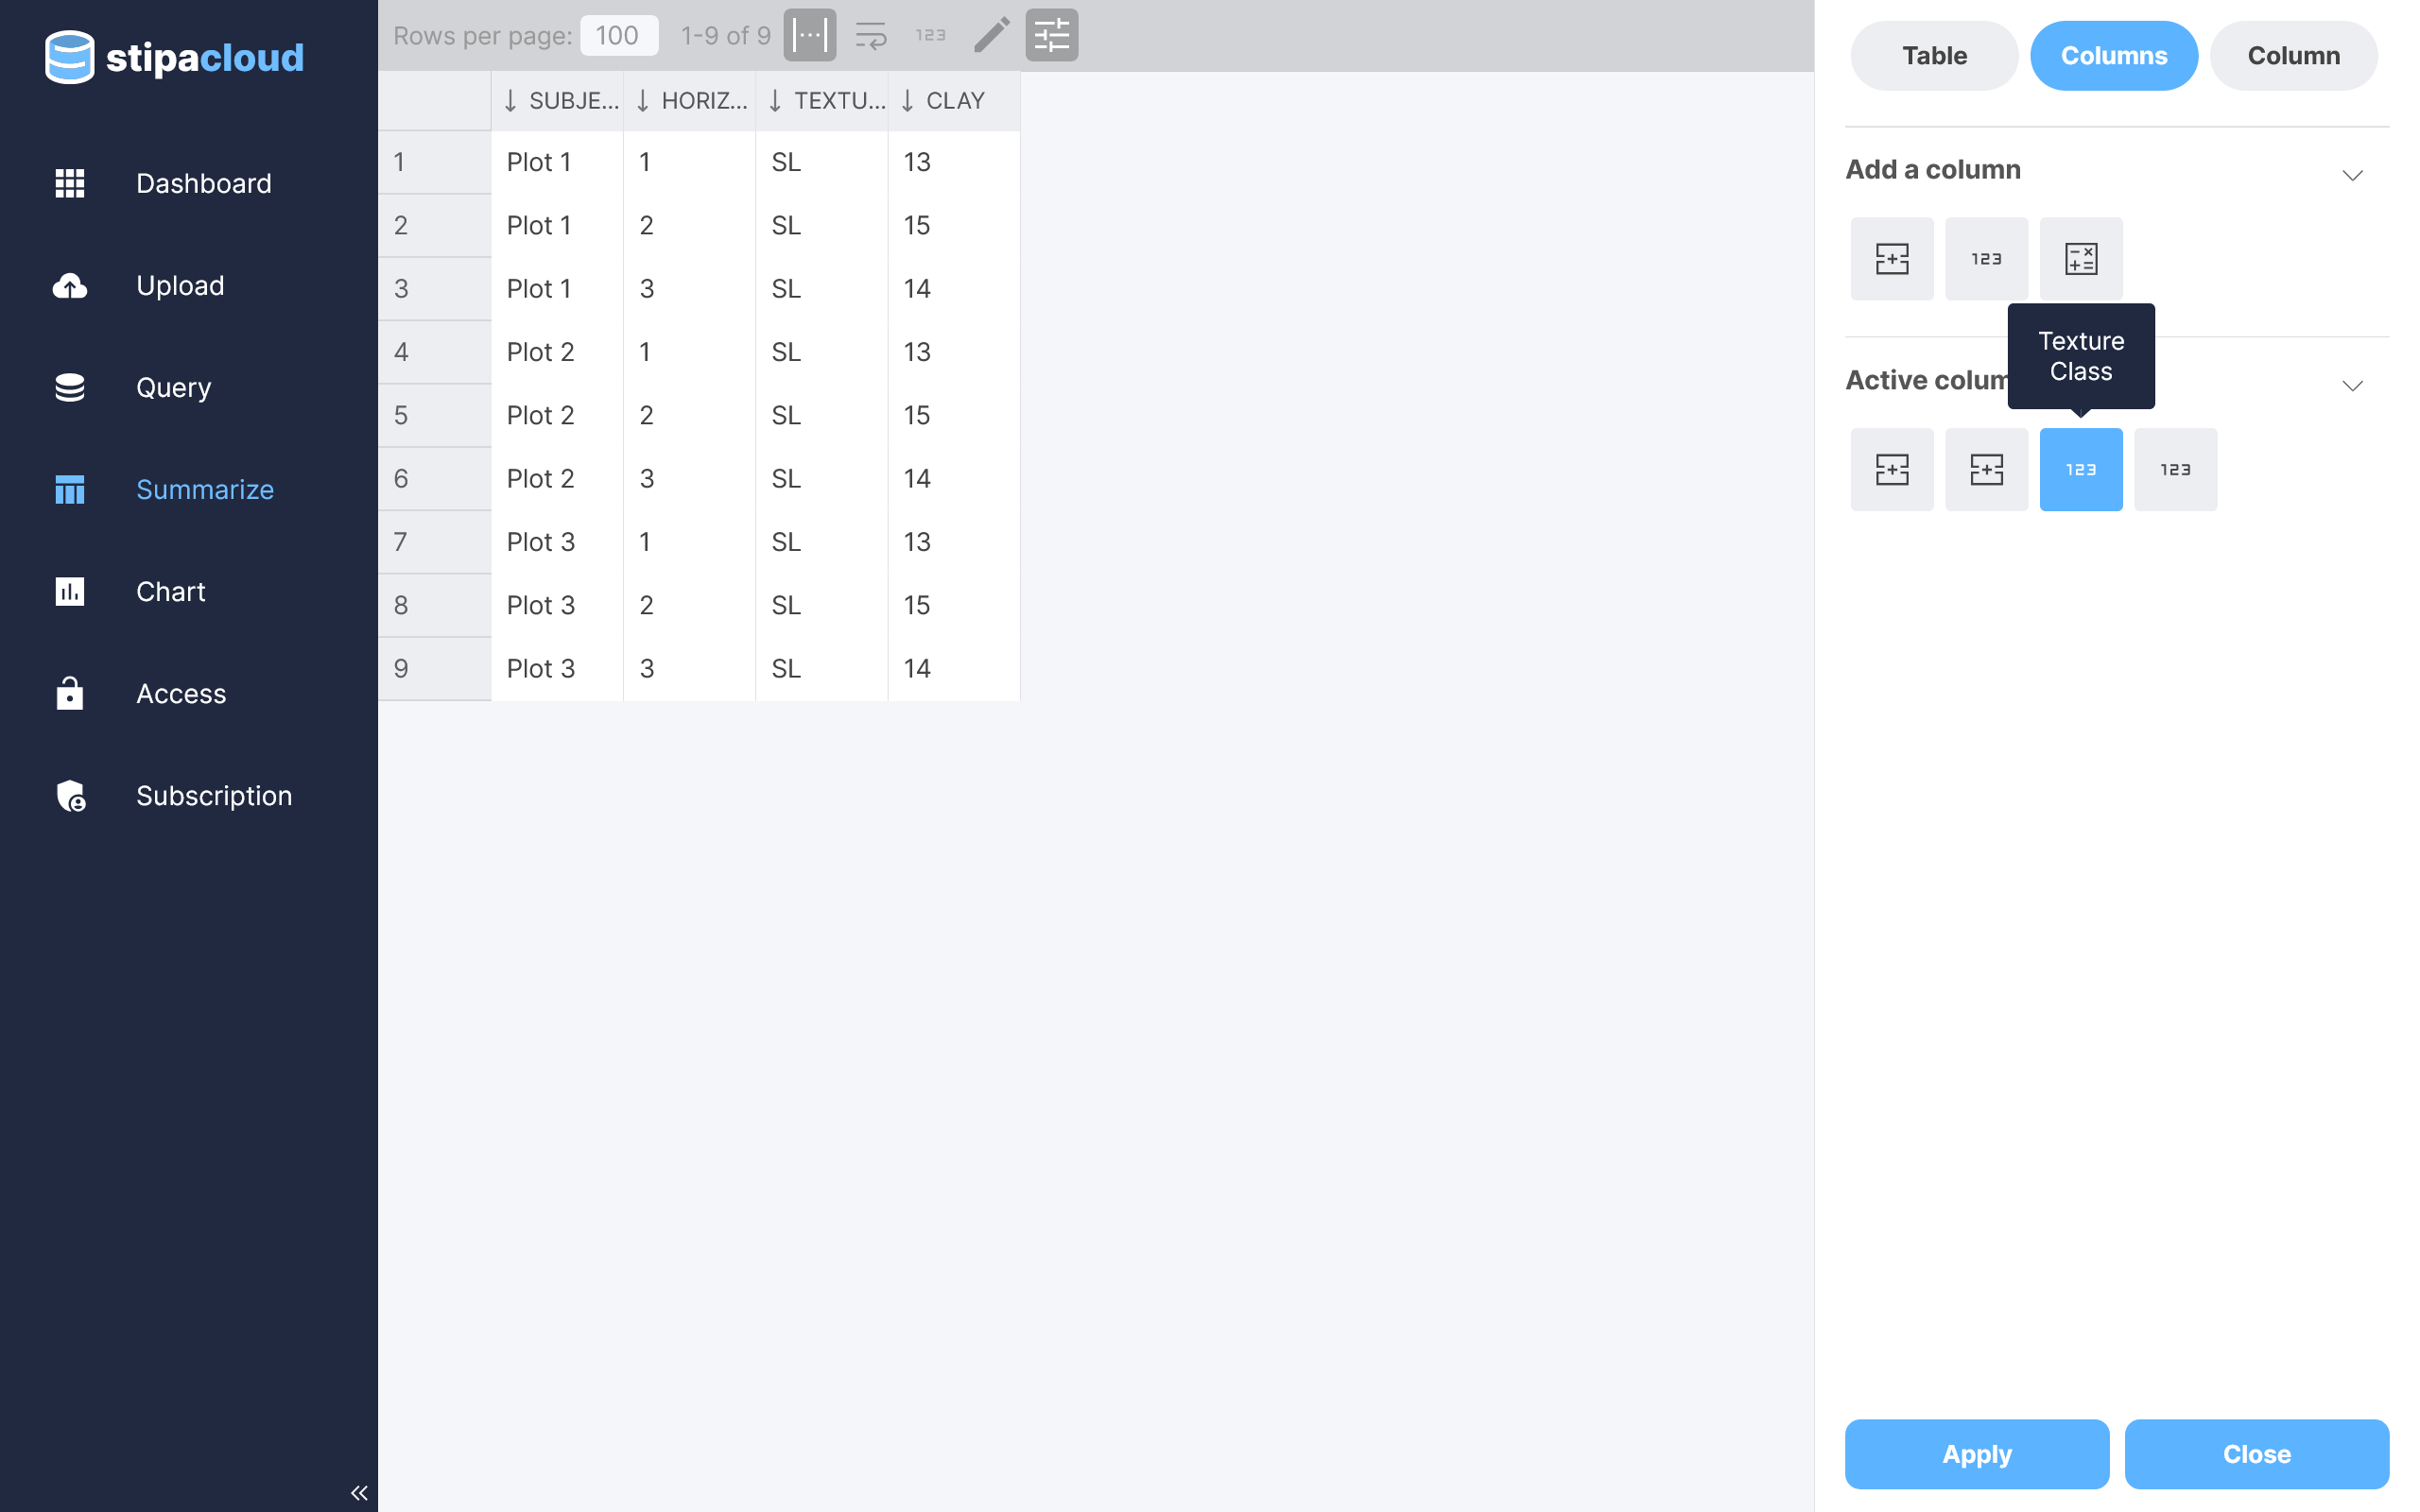
Figure 9. Adding and removing table columns.
Column properties can also be edited by toggling the Edit Mode button and clicking on the Edit Column button displayed in the header of the relevant column.
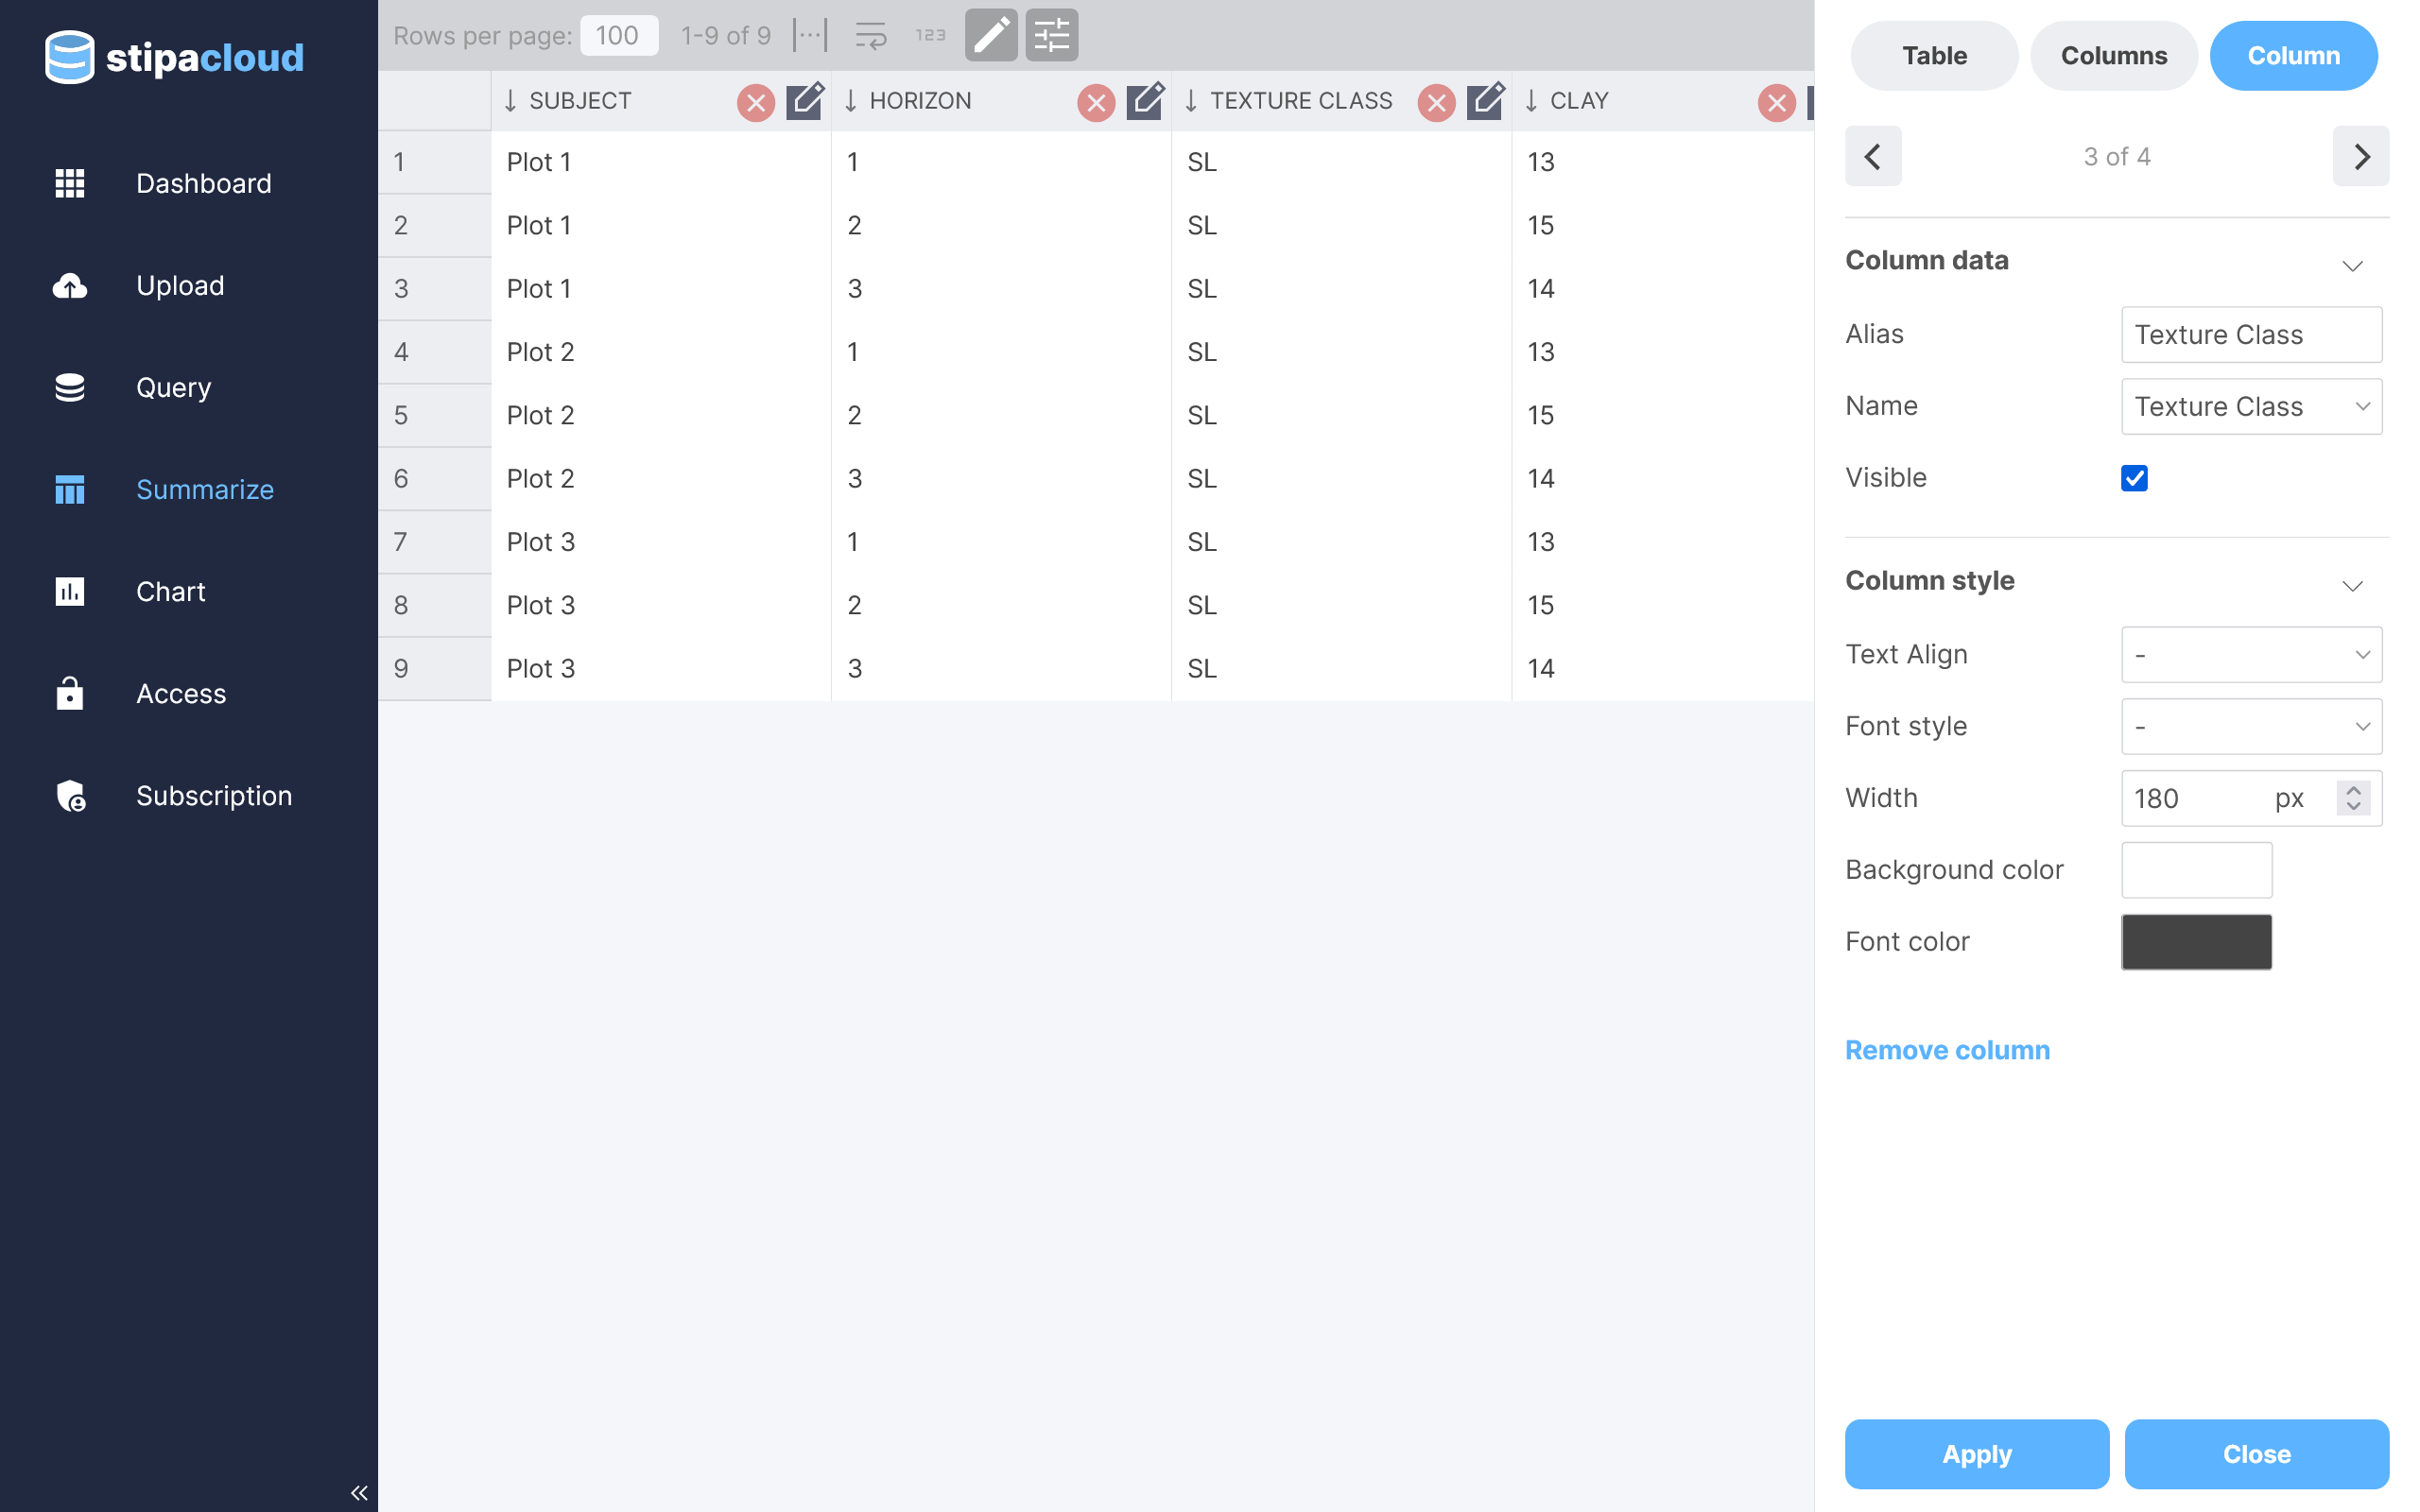
Figure 10. Editing column properties.
Custom styling can be applied to a summary table using the various options available on the Summary Table toolbar. Click the Apply button at any time to update the table with your changes.
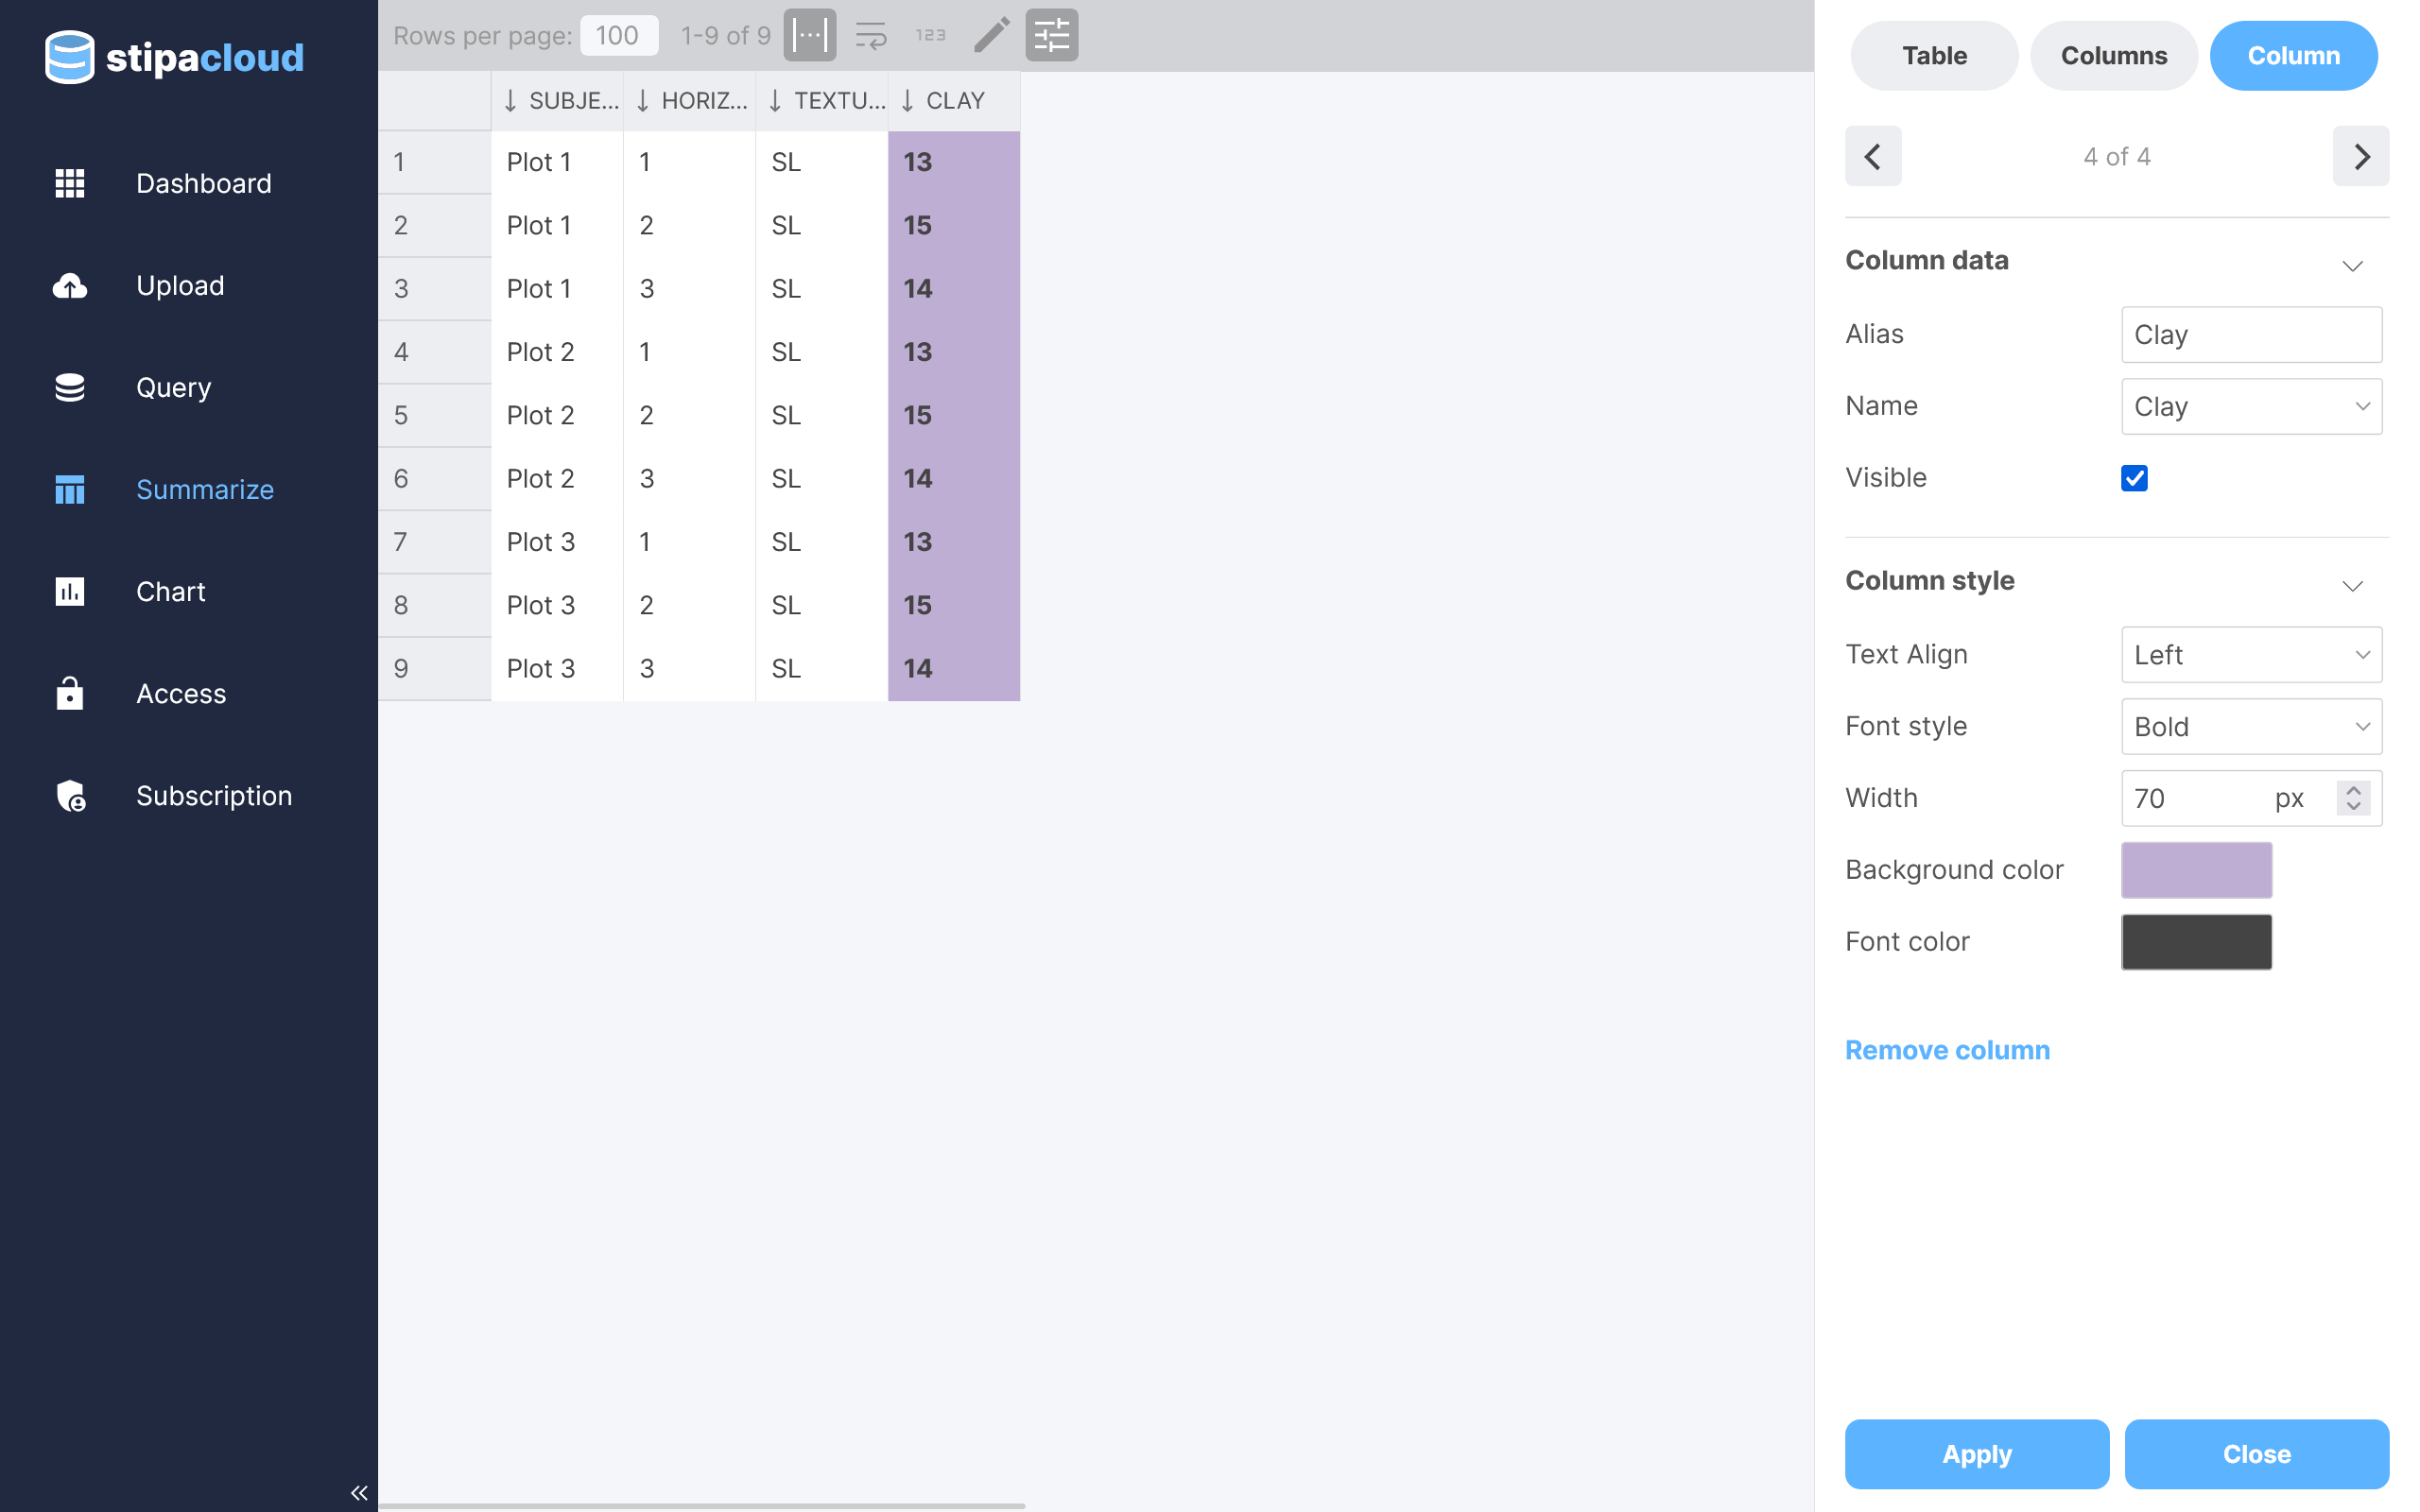
Figure 11. Styling a table.
By default, all data for the selected Project and Form will be used for the summary table. You can restrict which Subjects and Observations are included by selecting one or more filter from the Filters section of the Table panel.
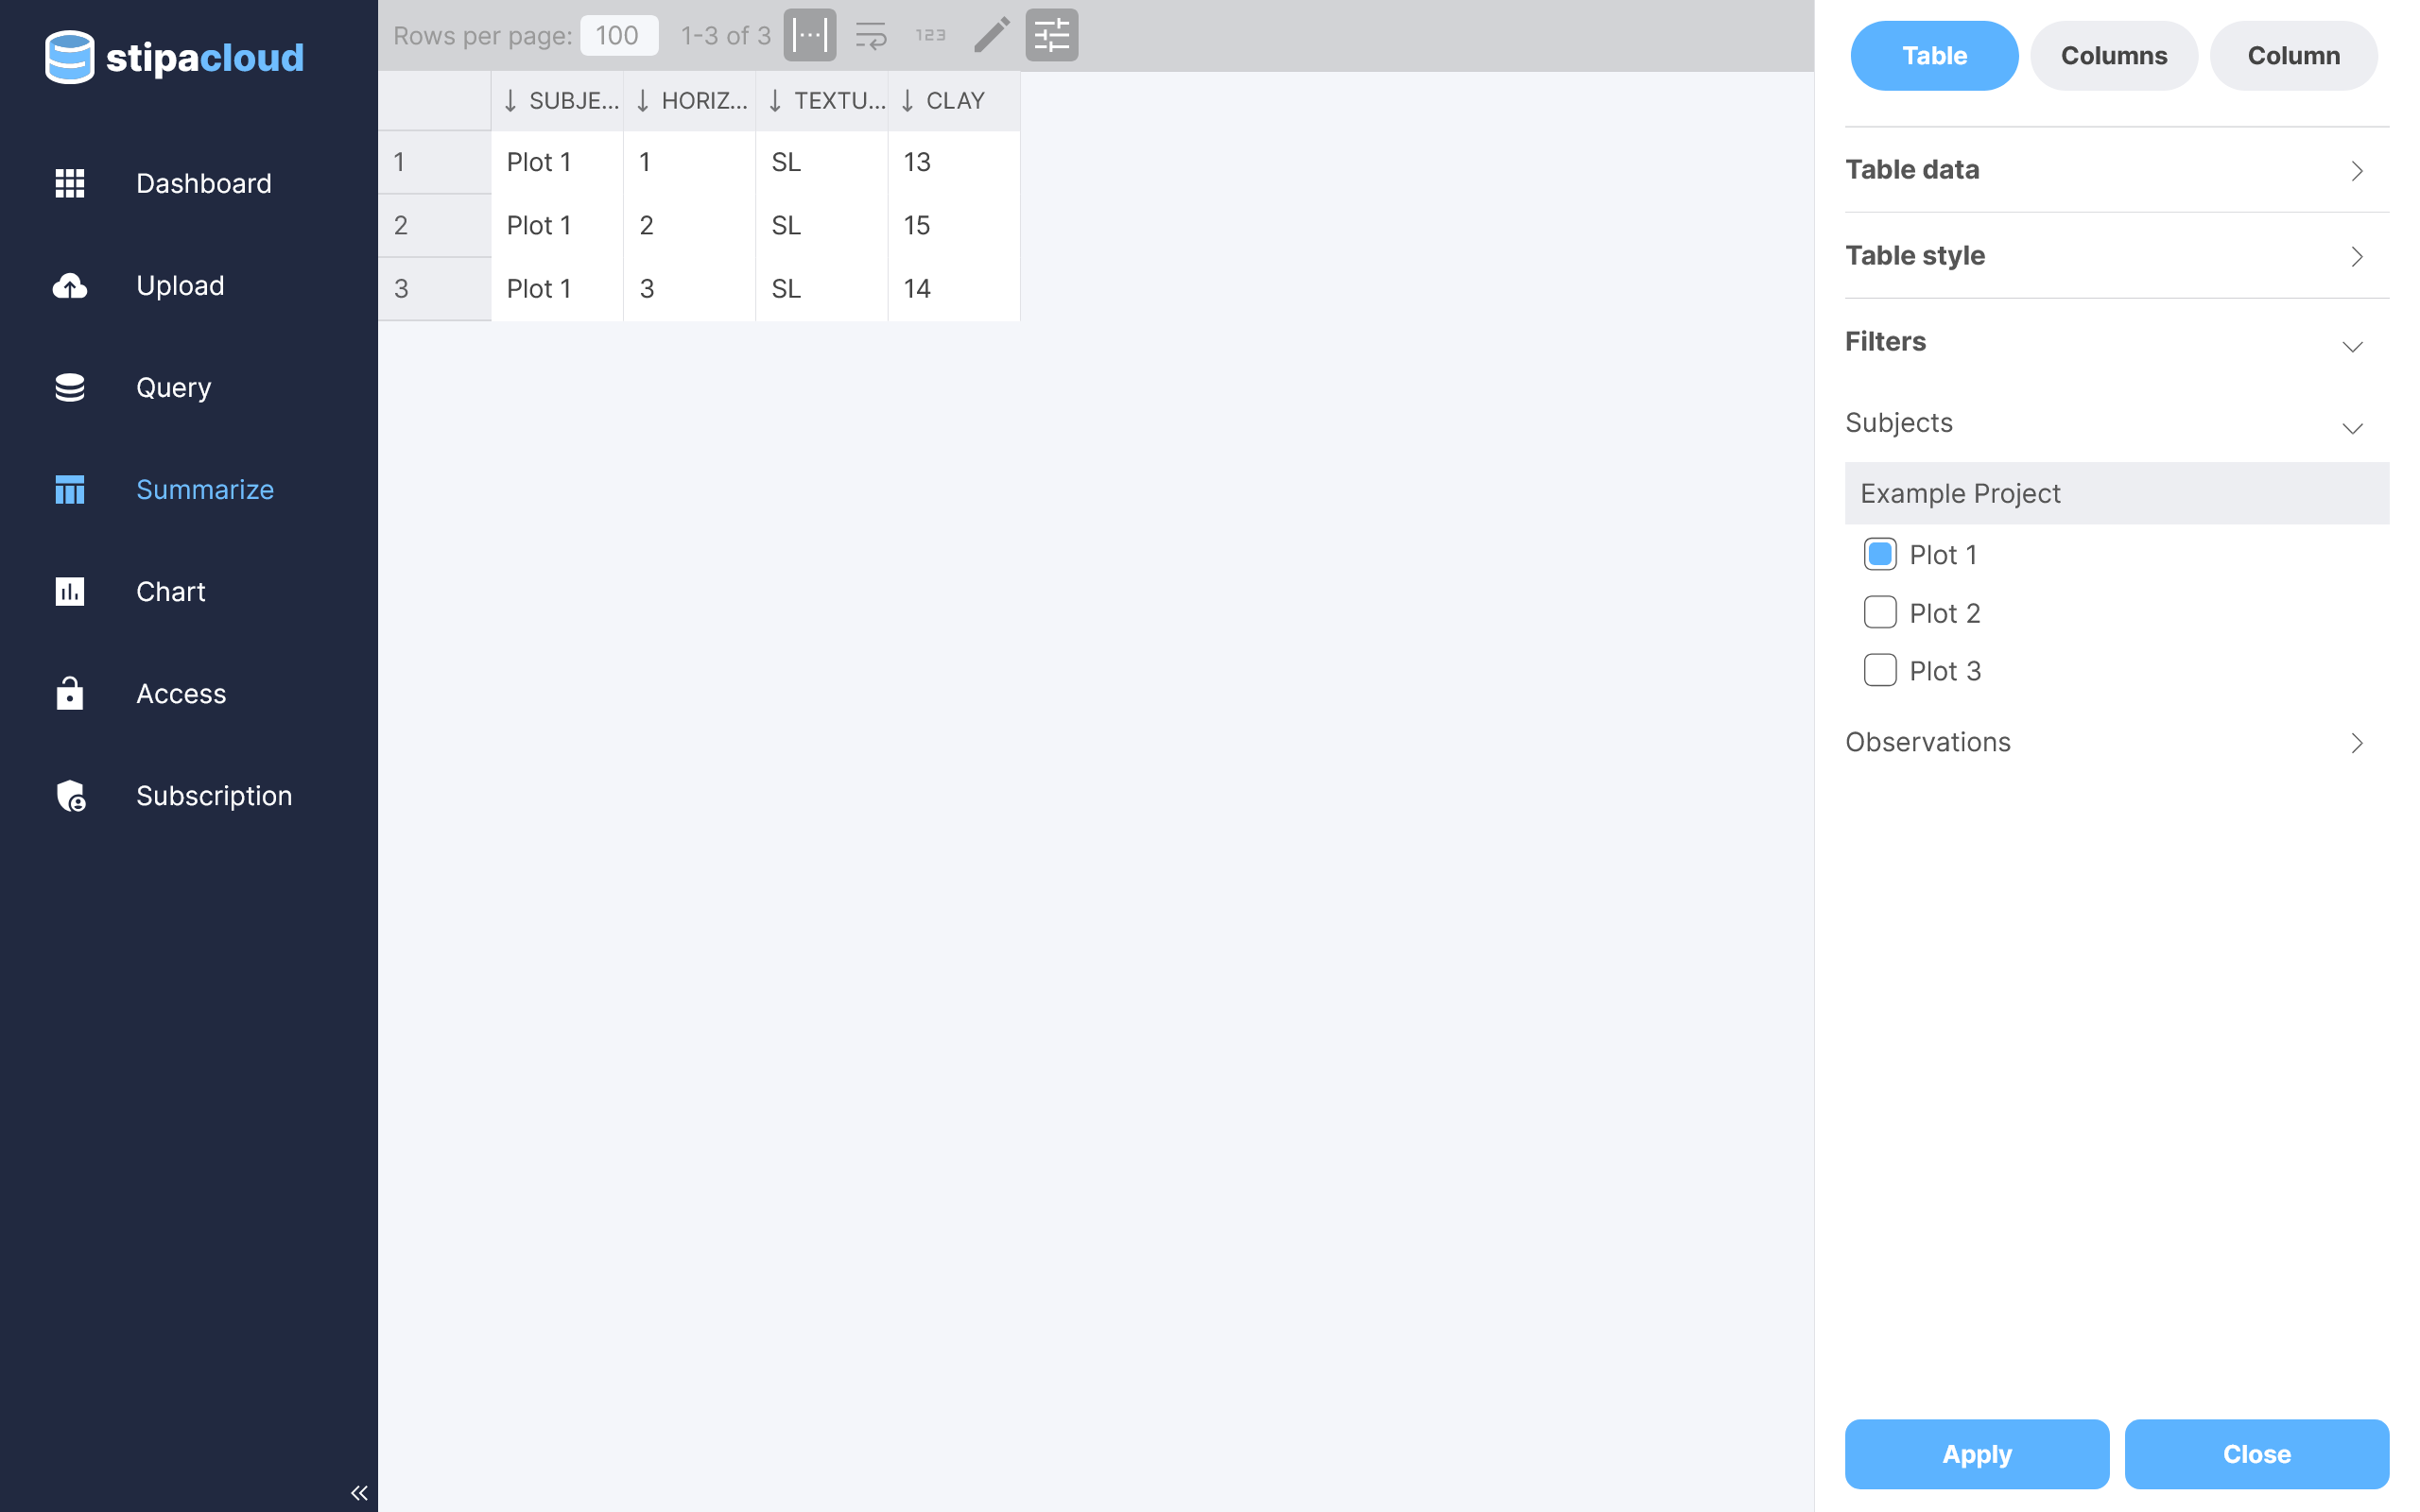
Figure 12. Filtering summary table data.
Save a summary using the save buttons in the upper right corner of the view. Any saved summary can be immediately accessed via the Dashboard view. Share, export, or delete a summary using the overflow menu located in the upper right corner of the catalog item.