Charting Your Data

Charts are a powerful way to turn information into insights. Charts convert raw data into something your brain can actually see and understand. As a result, they often explain in seconds certain trends and patterns not readily apparent in a table of data.
Stipa Cloud allows you to create charts without migrating your data to third-party software. Our chart interface is built upon Observable's Plot library and supports a wide variety of data visualizations.
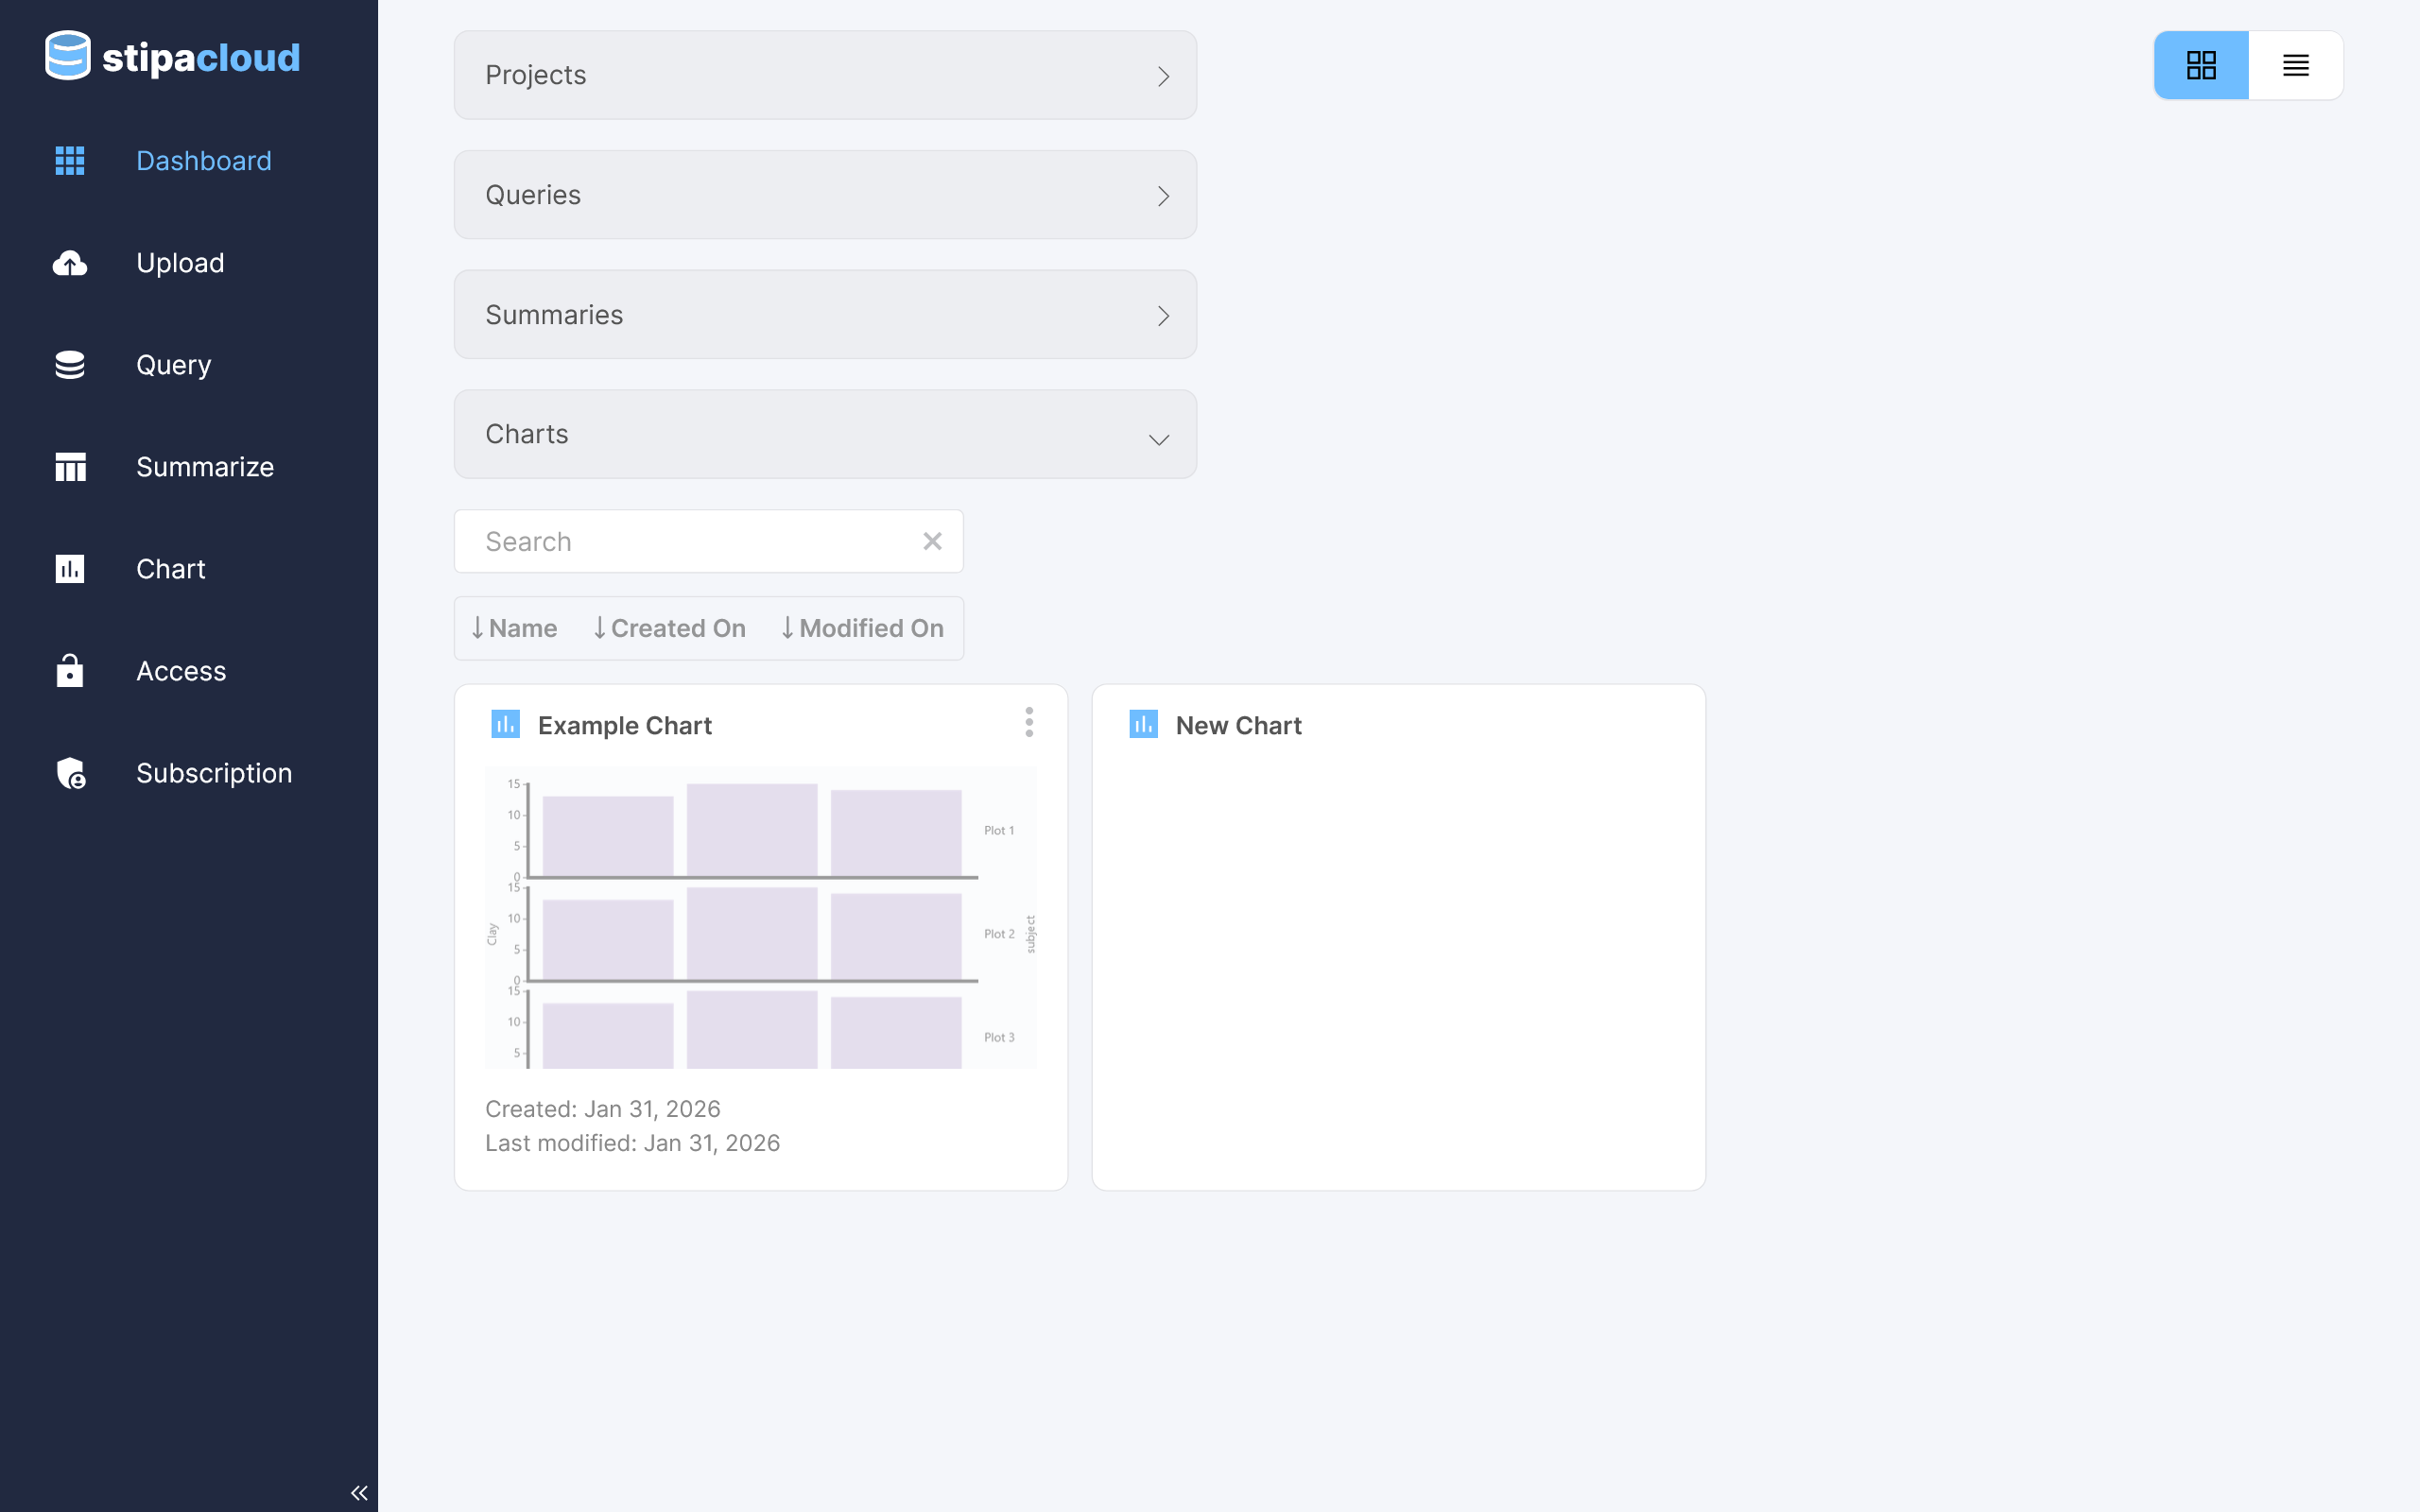
After logging in to the dashboard page, navigate to the Chart view by selecting the appropriate tab from the menu on the left side of the screen.
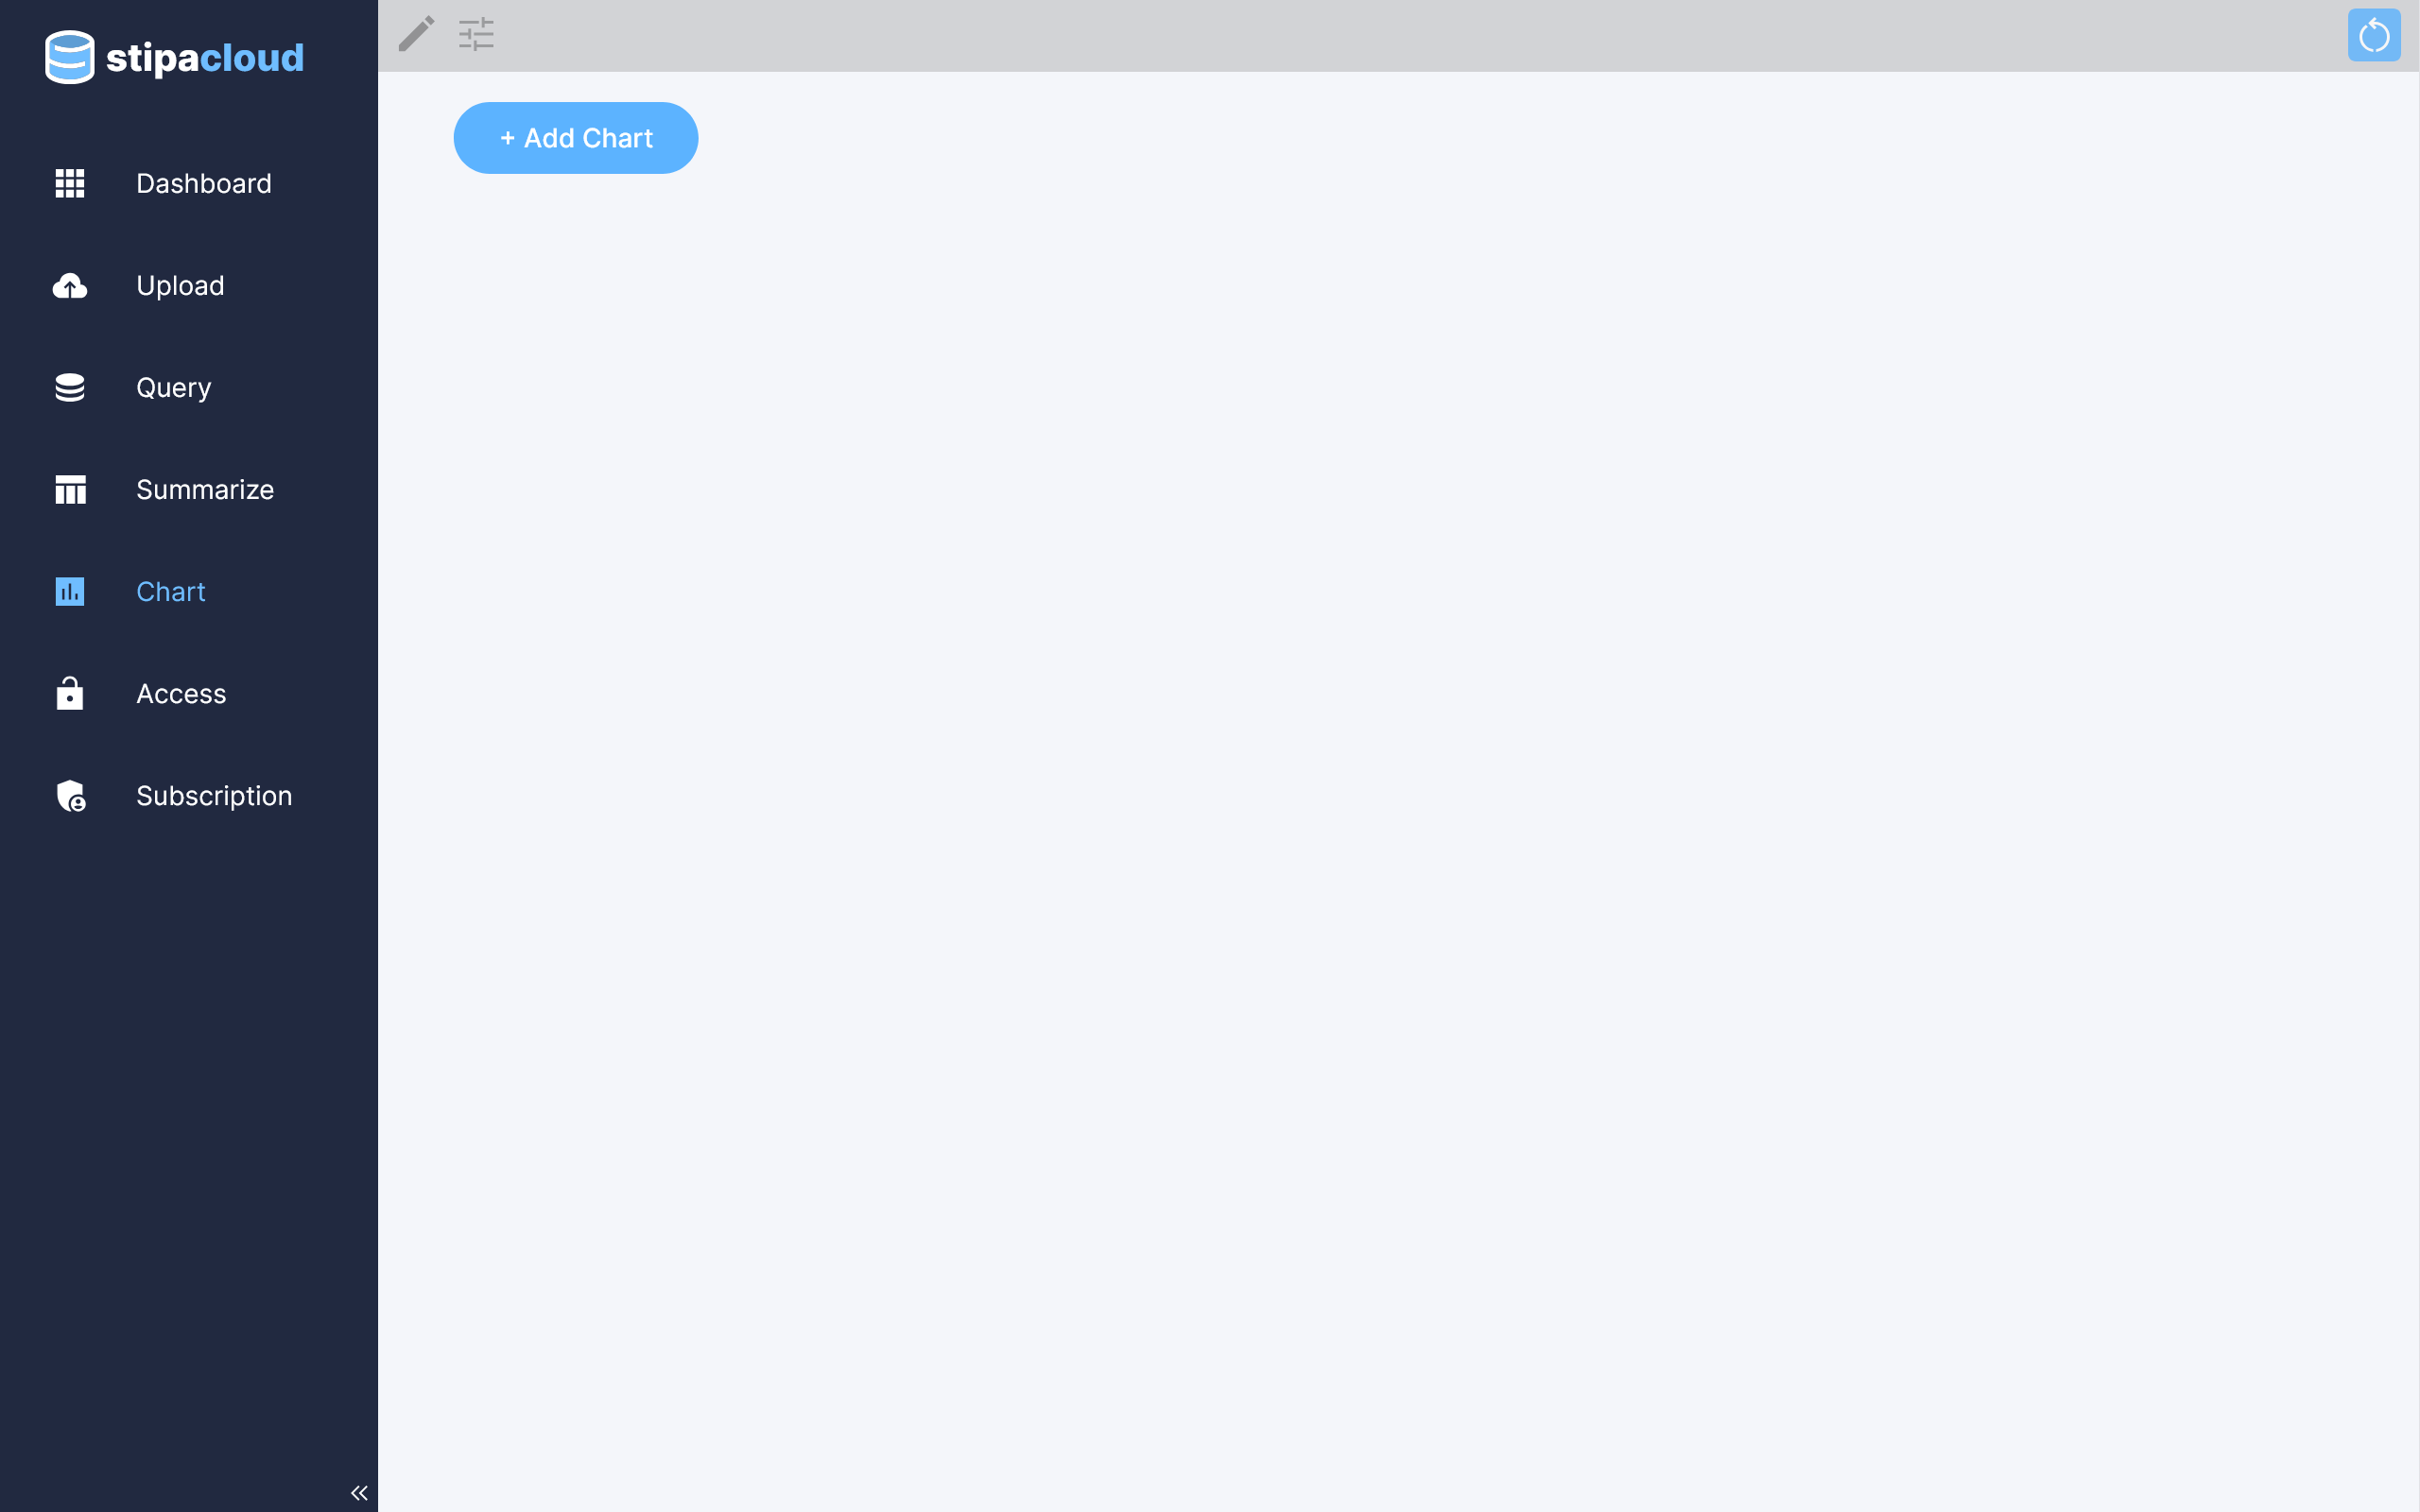
Figure 1. Chart view.
Click on the Add Chart button to open a toolbar for creating a new chart. You can also open the toolbar by clicking on the Toggle Settings button at the top of the view.
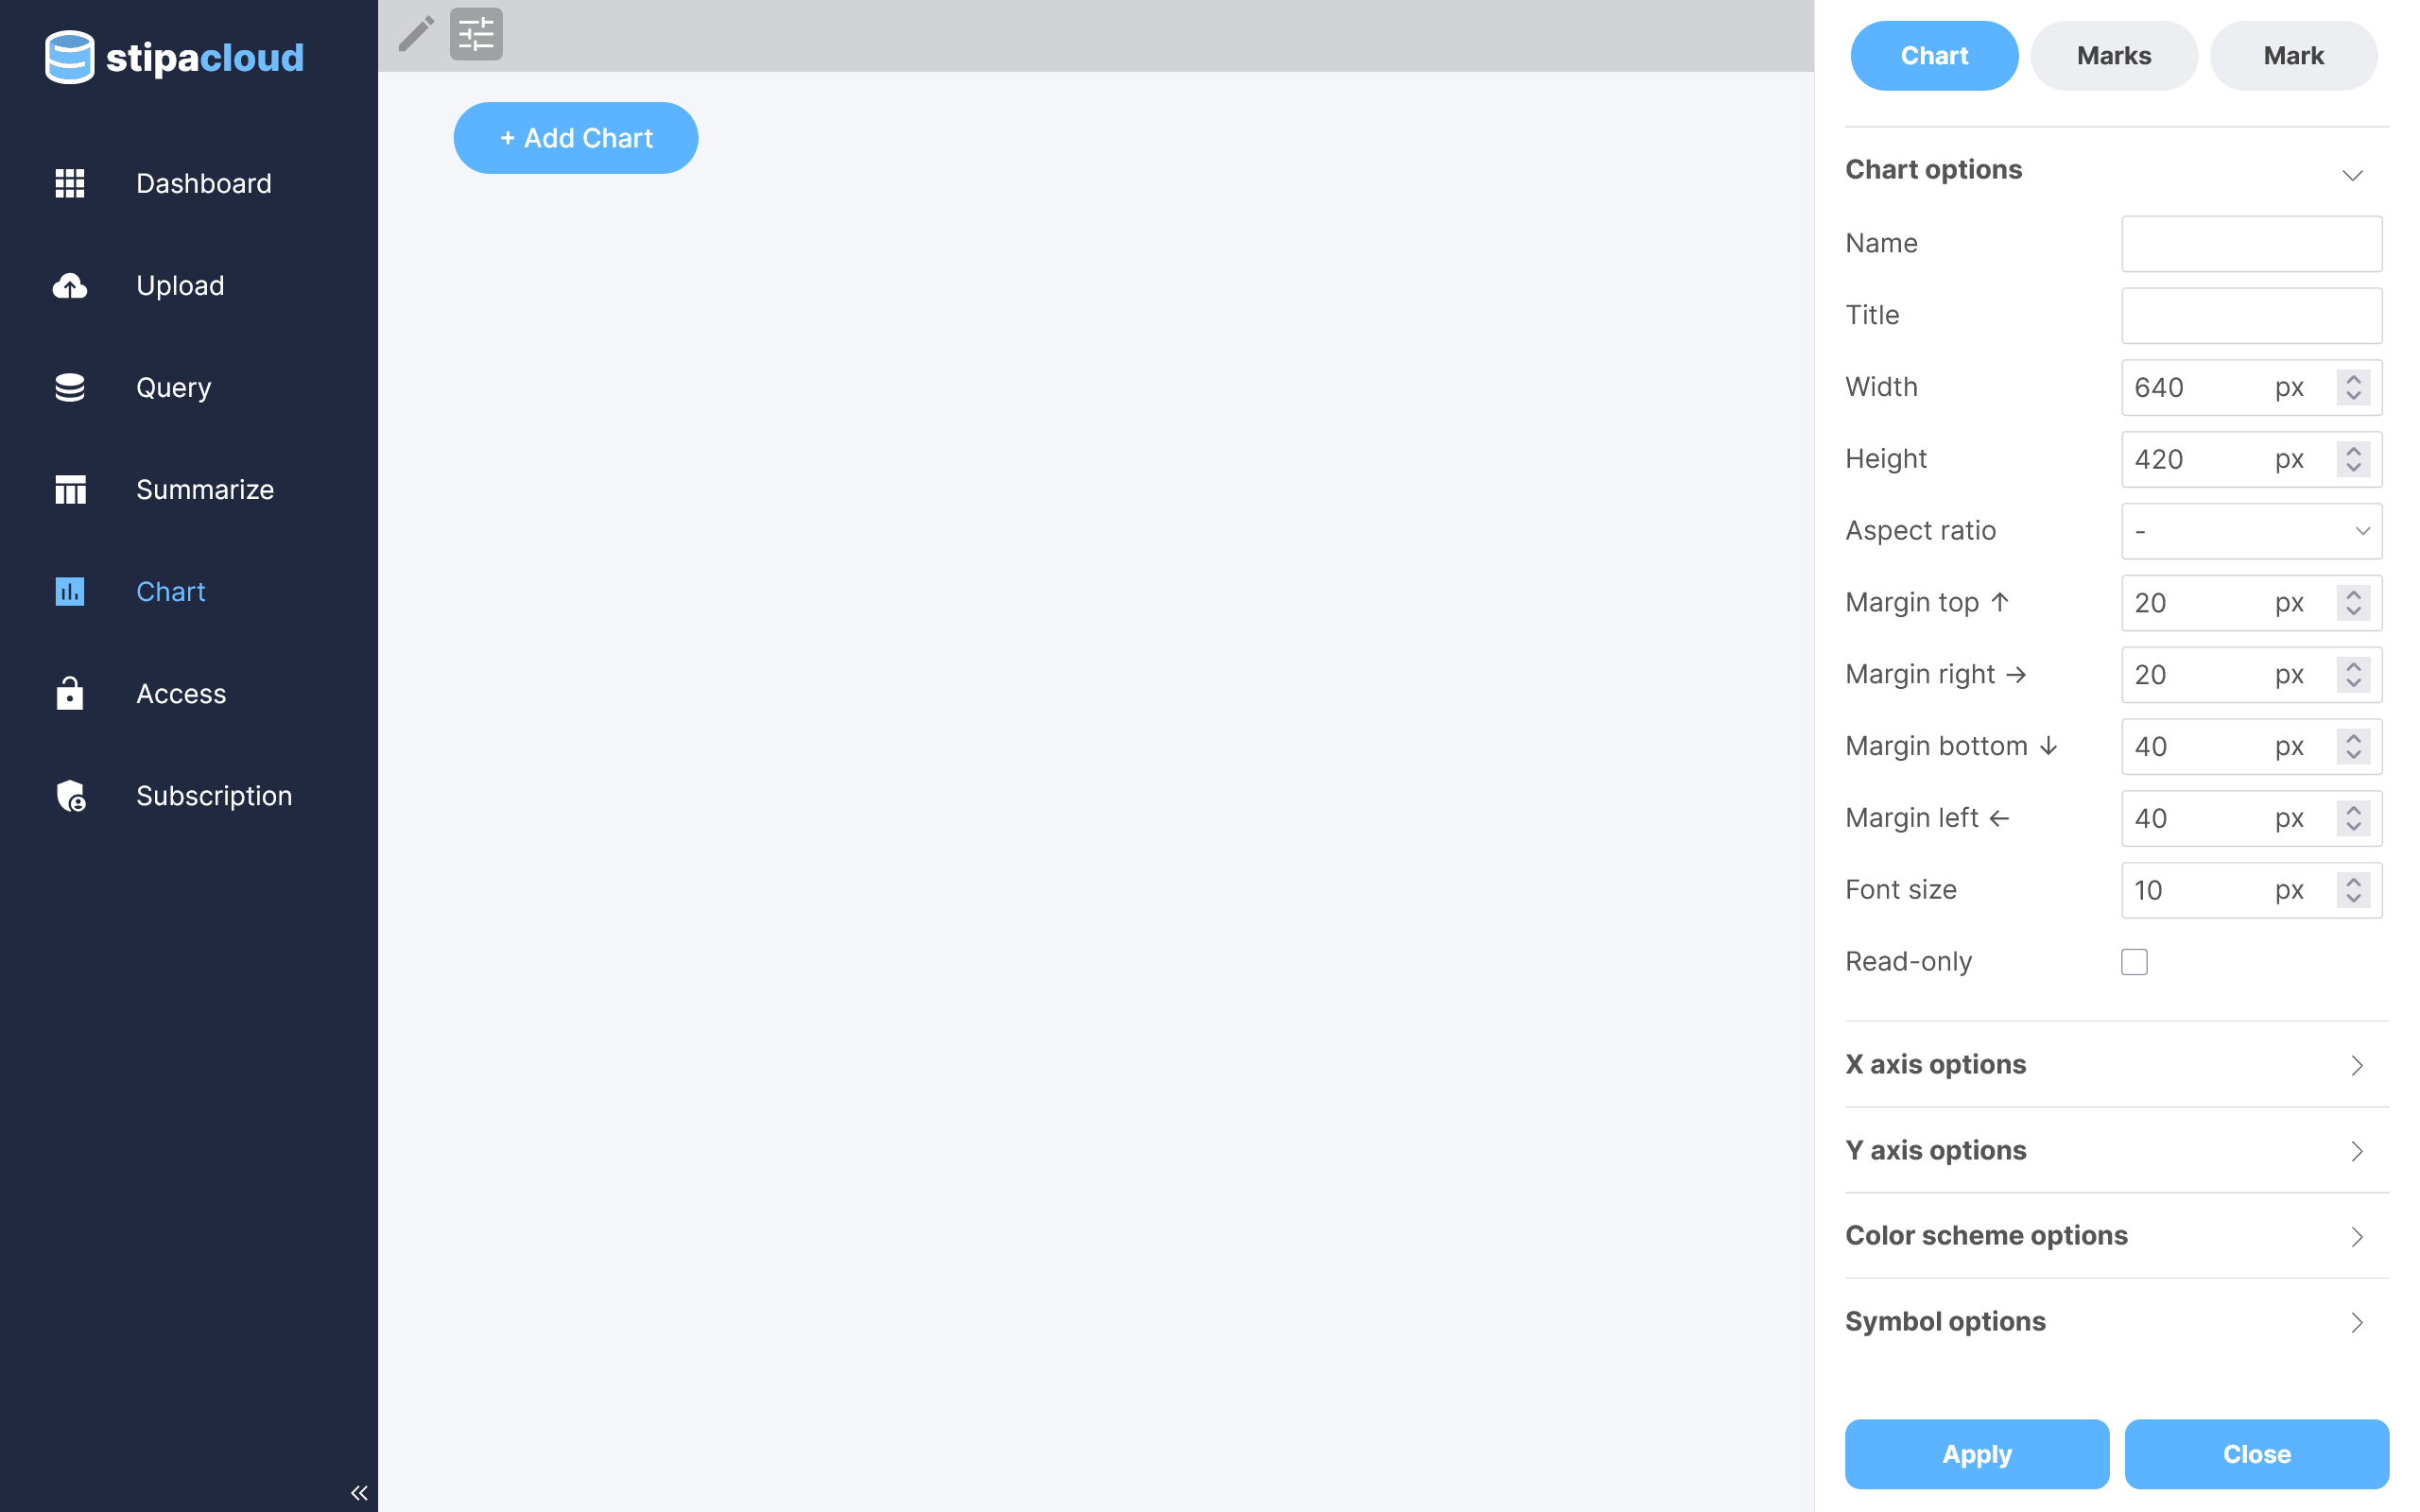
Figure 2. Editing chart settings.
Click on the Marks tab at the top of the settings toolbar to manage which marks are included in the chart. The Stipa Cloud chart interface conforms to Observable's somewhat unconventional, but highly customizable, approach to creating charts. Instead of choosing from a limited number of pre-defined chart types, you select the individual components, or marks, (e.g., line, bar, axis) you'd like to include in your chart.
The menu at the top of this panel contains the various marks you are able to add. Click on the desired menu option to add that mark to the chart. View the name of a mark by hovering over the menu option.
The bottom menu contains all of the marks you have added. Click on a menu option to edit the properties of that mark. Remove a mark by dragging the menu option back to the top menu. Change the z-order of marks by dragging a menu option left or right.
Click the Apply button at any time to update the table with your changes.
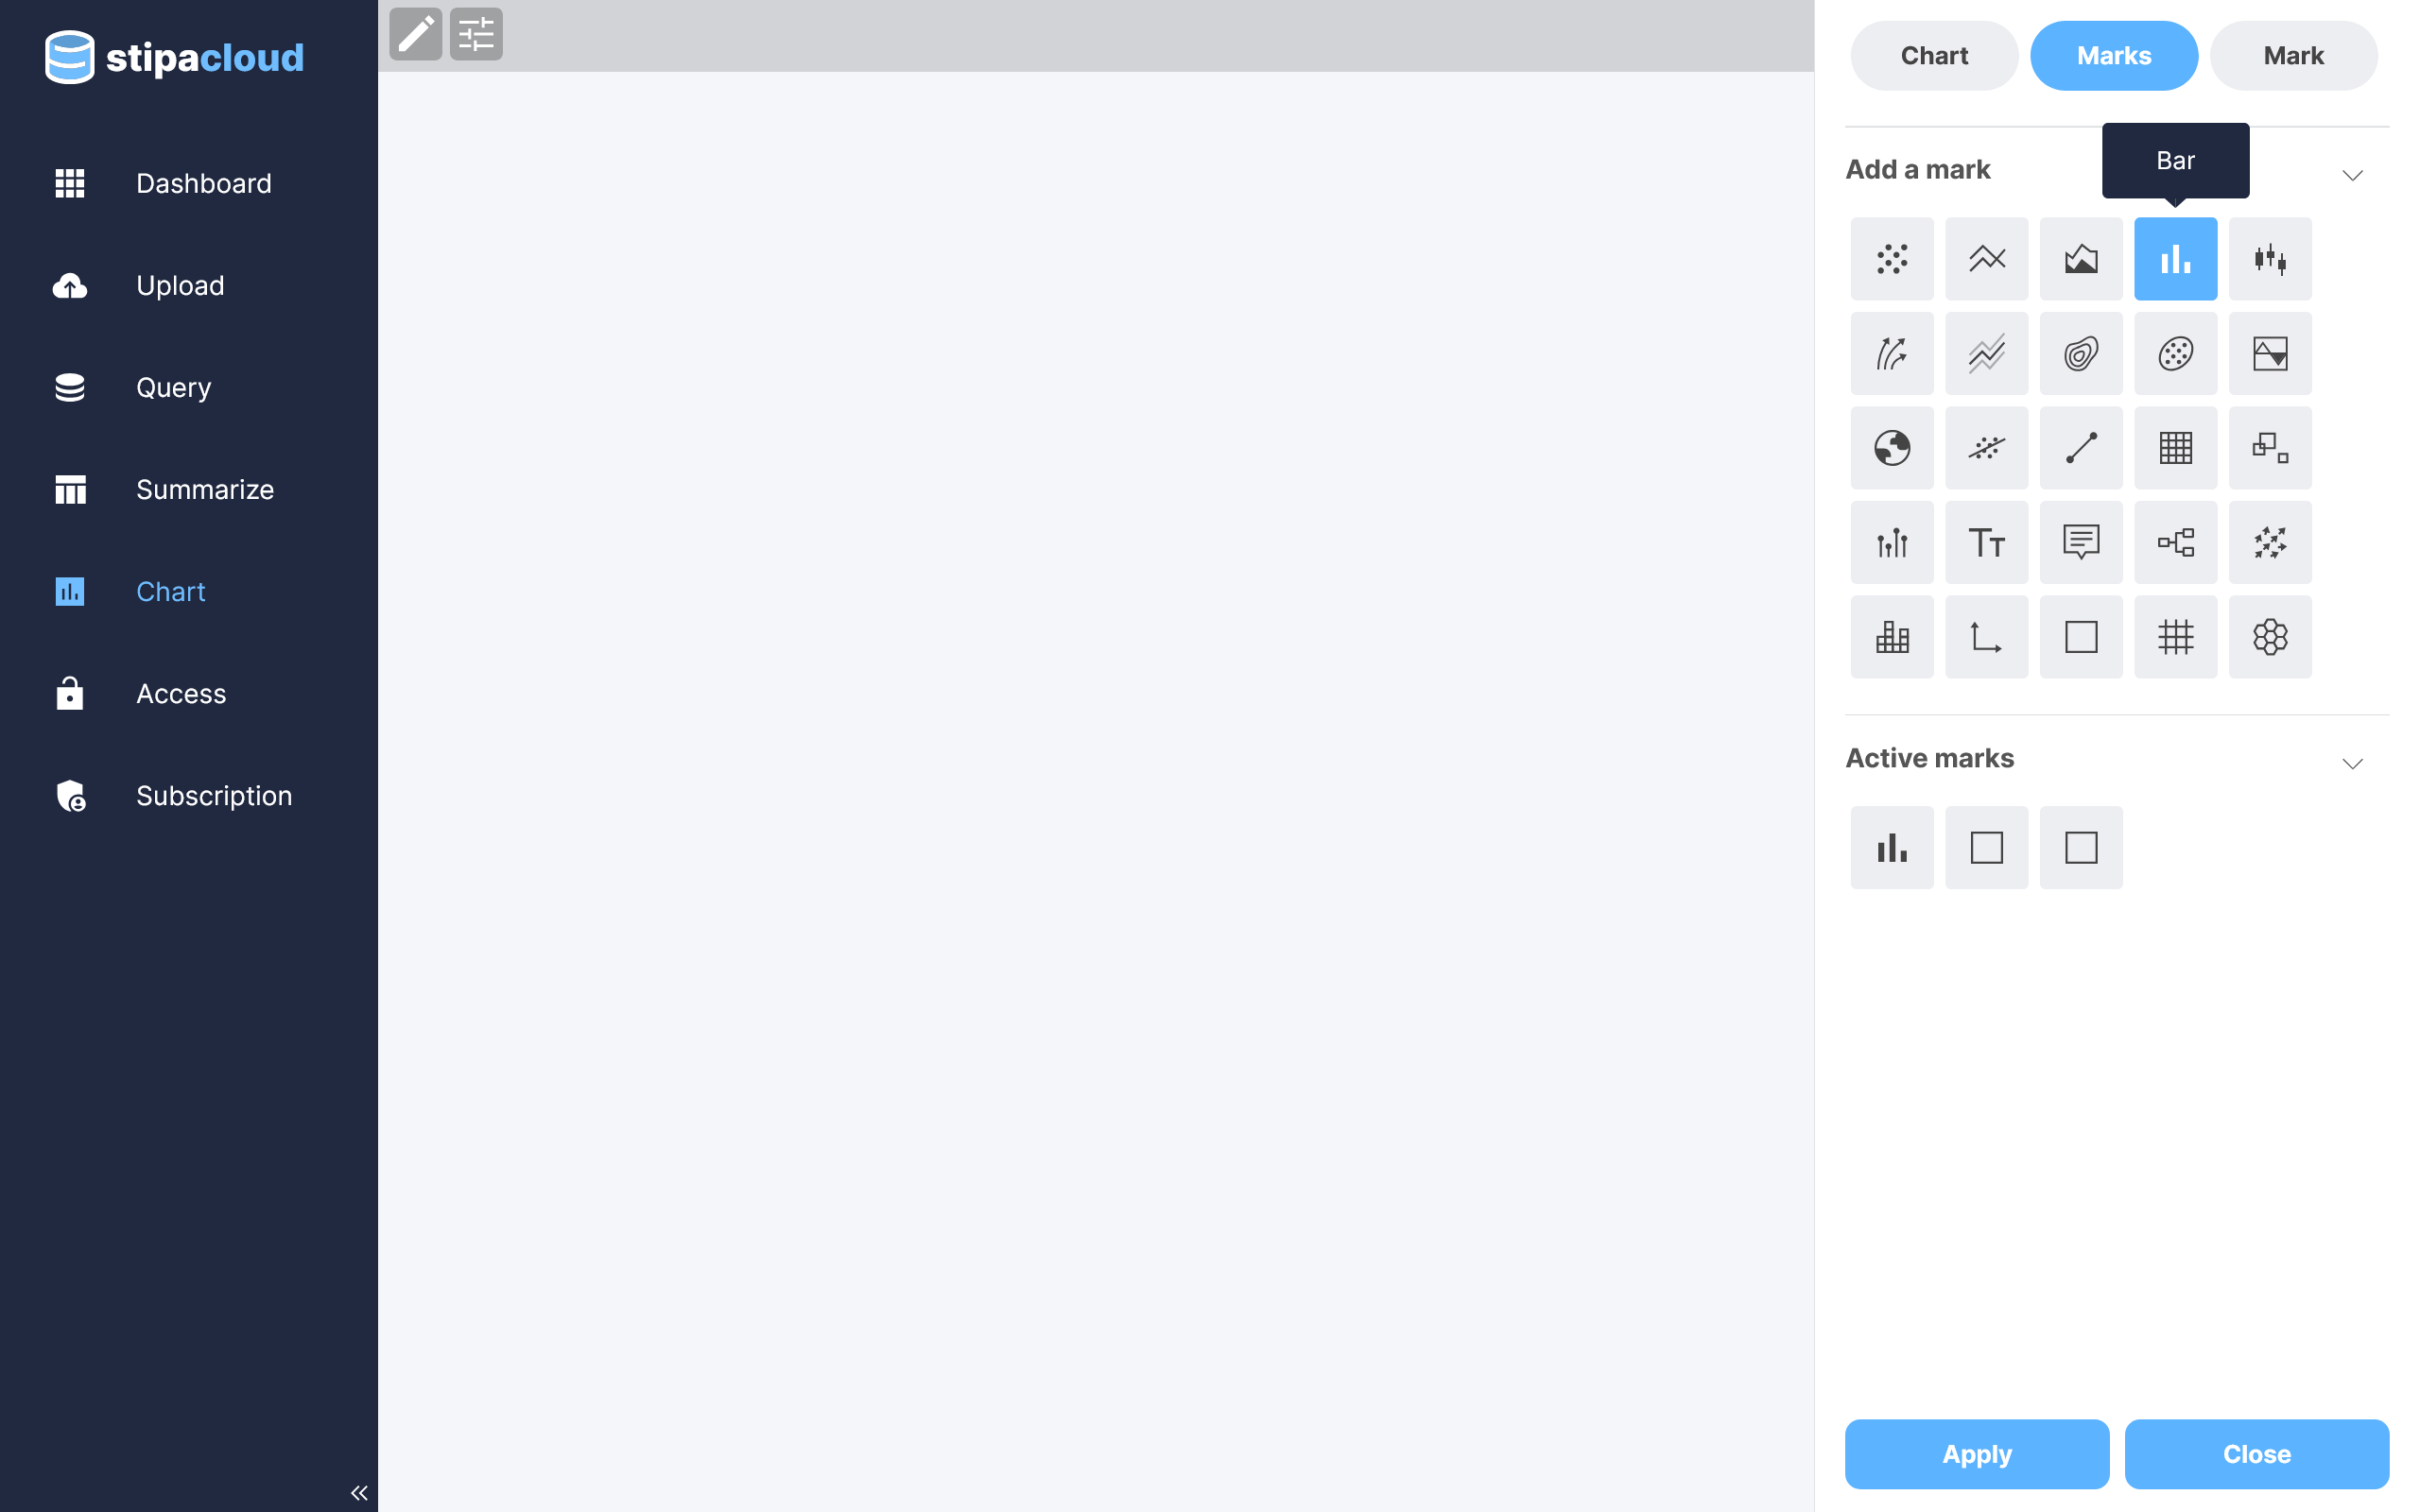
Figure 3. Adding and removing chart marks.
The data used to draw a mark must come from a Summary you have already saved to your subscription. Select the Summary you will use for the selected mark. In most cases, you will also need to specify the columns to be used for the x and y dimensions. Different marks can utilize data from different Summaries. Marks such as axis, frame, and grid do not require a Summary to be specified.
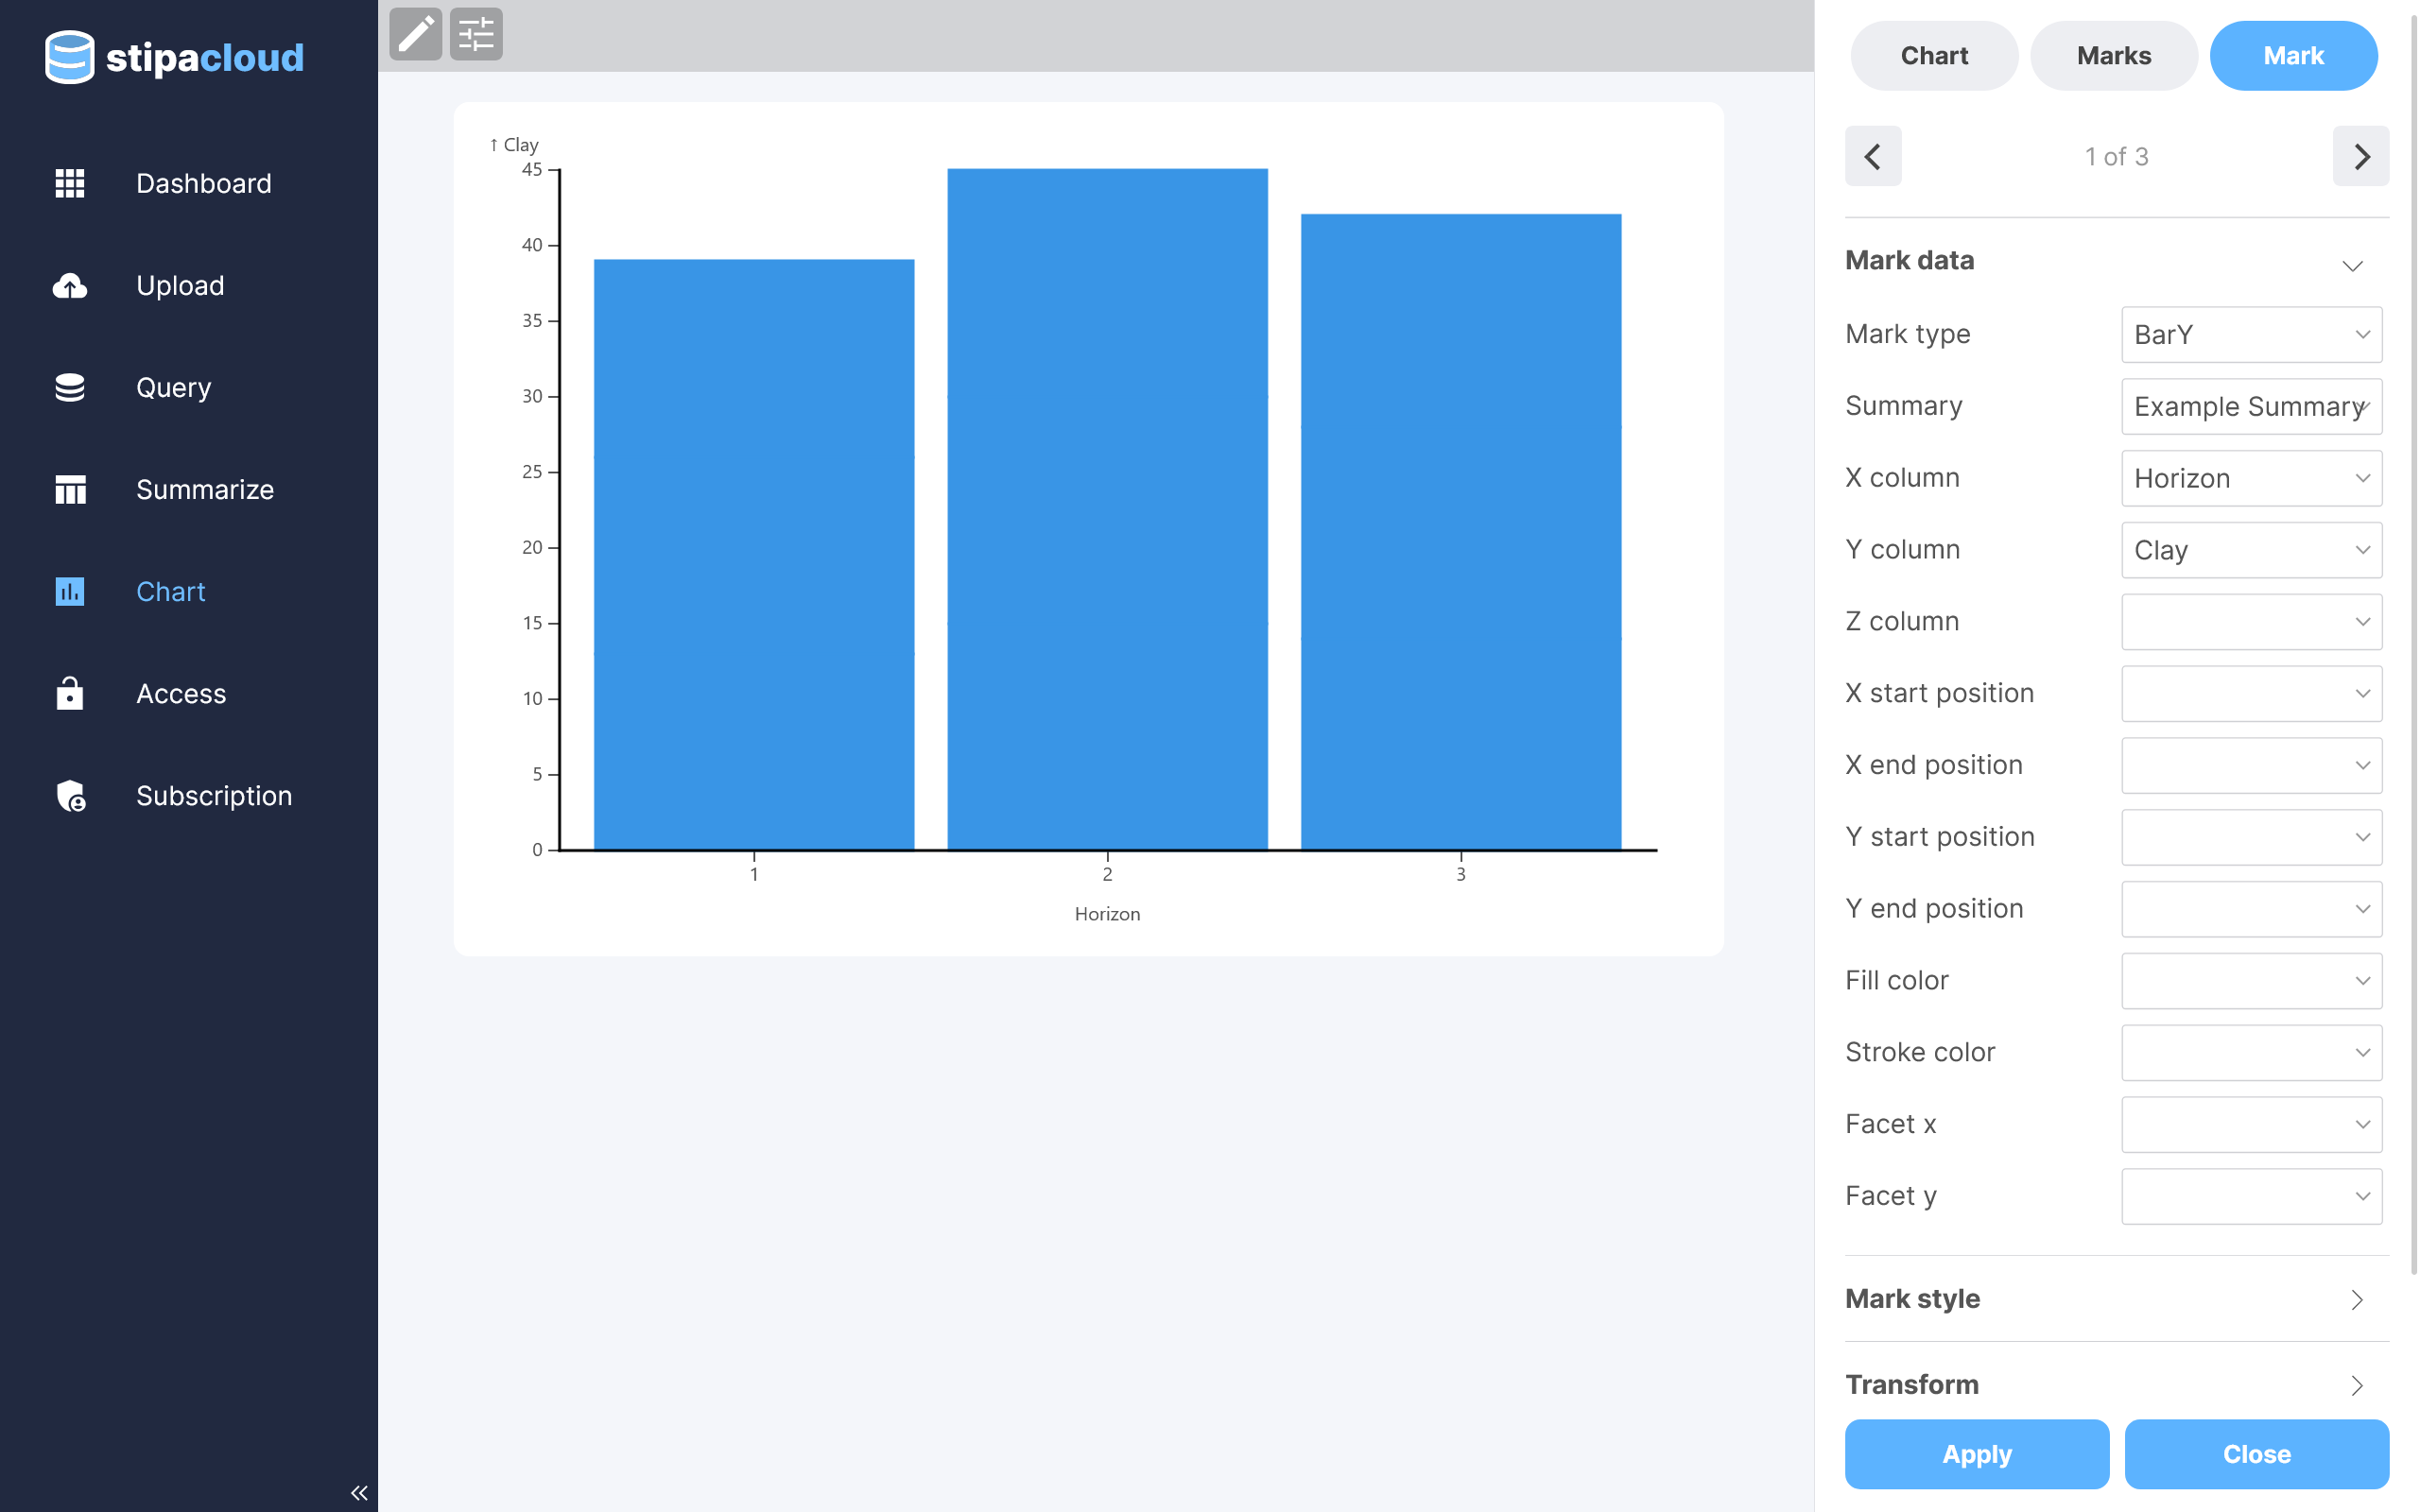
Figure 4. Editing a mark.
Custom styling can be applied to a mark using various options available in the Style section of the Mark panel. Chart and axis styling can also be customized using options available in the Chart panel. Click the Apply button at any time to update the table with your changes.
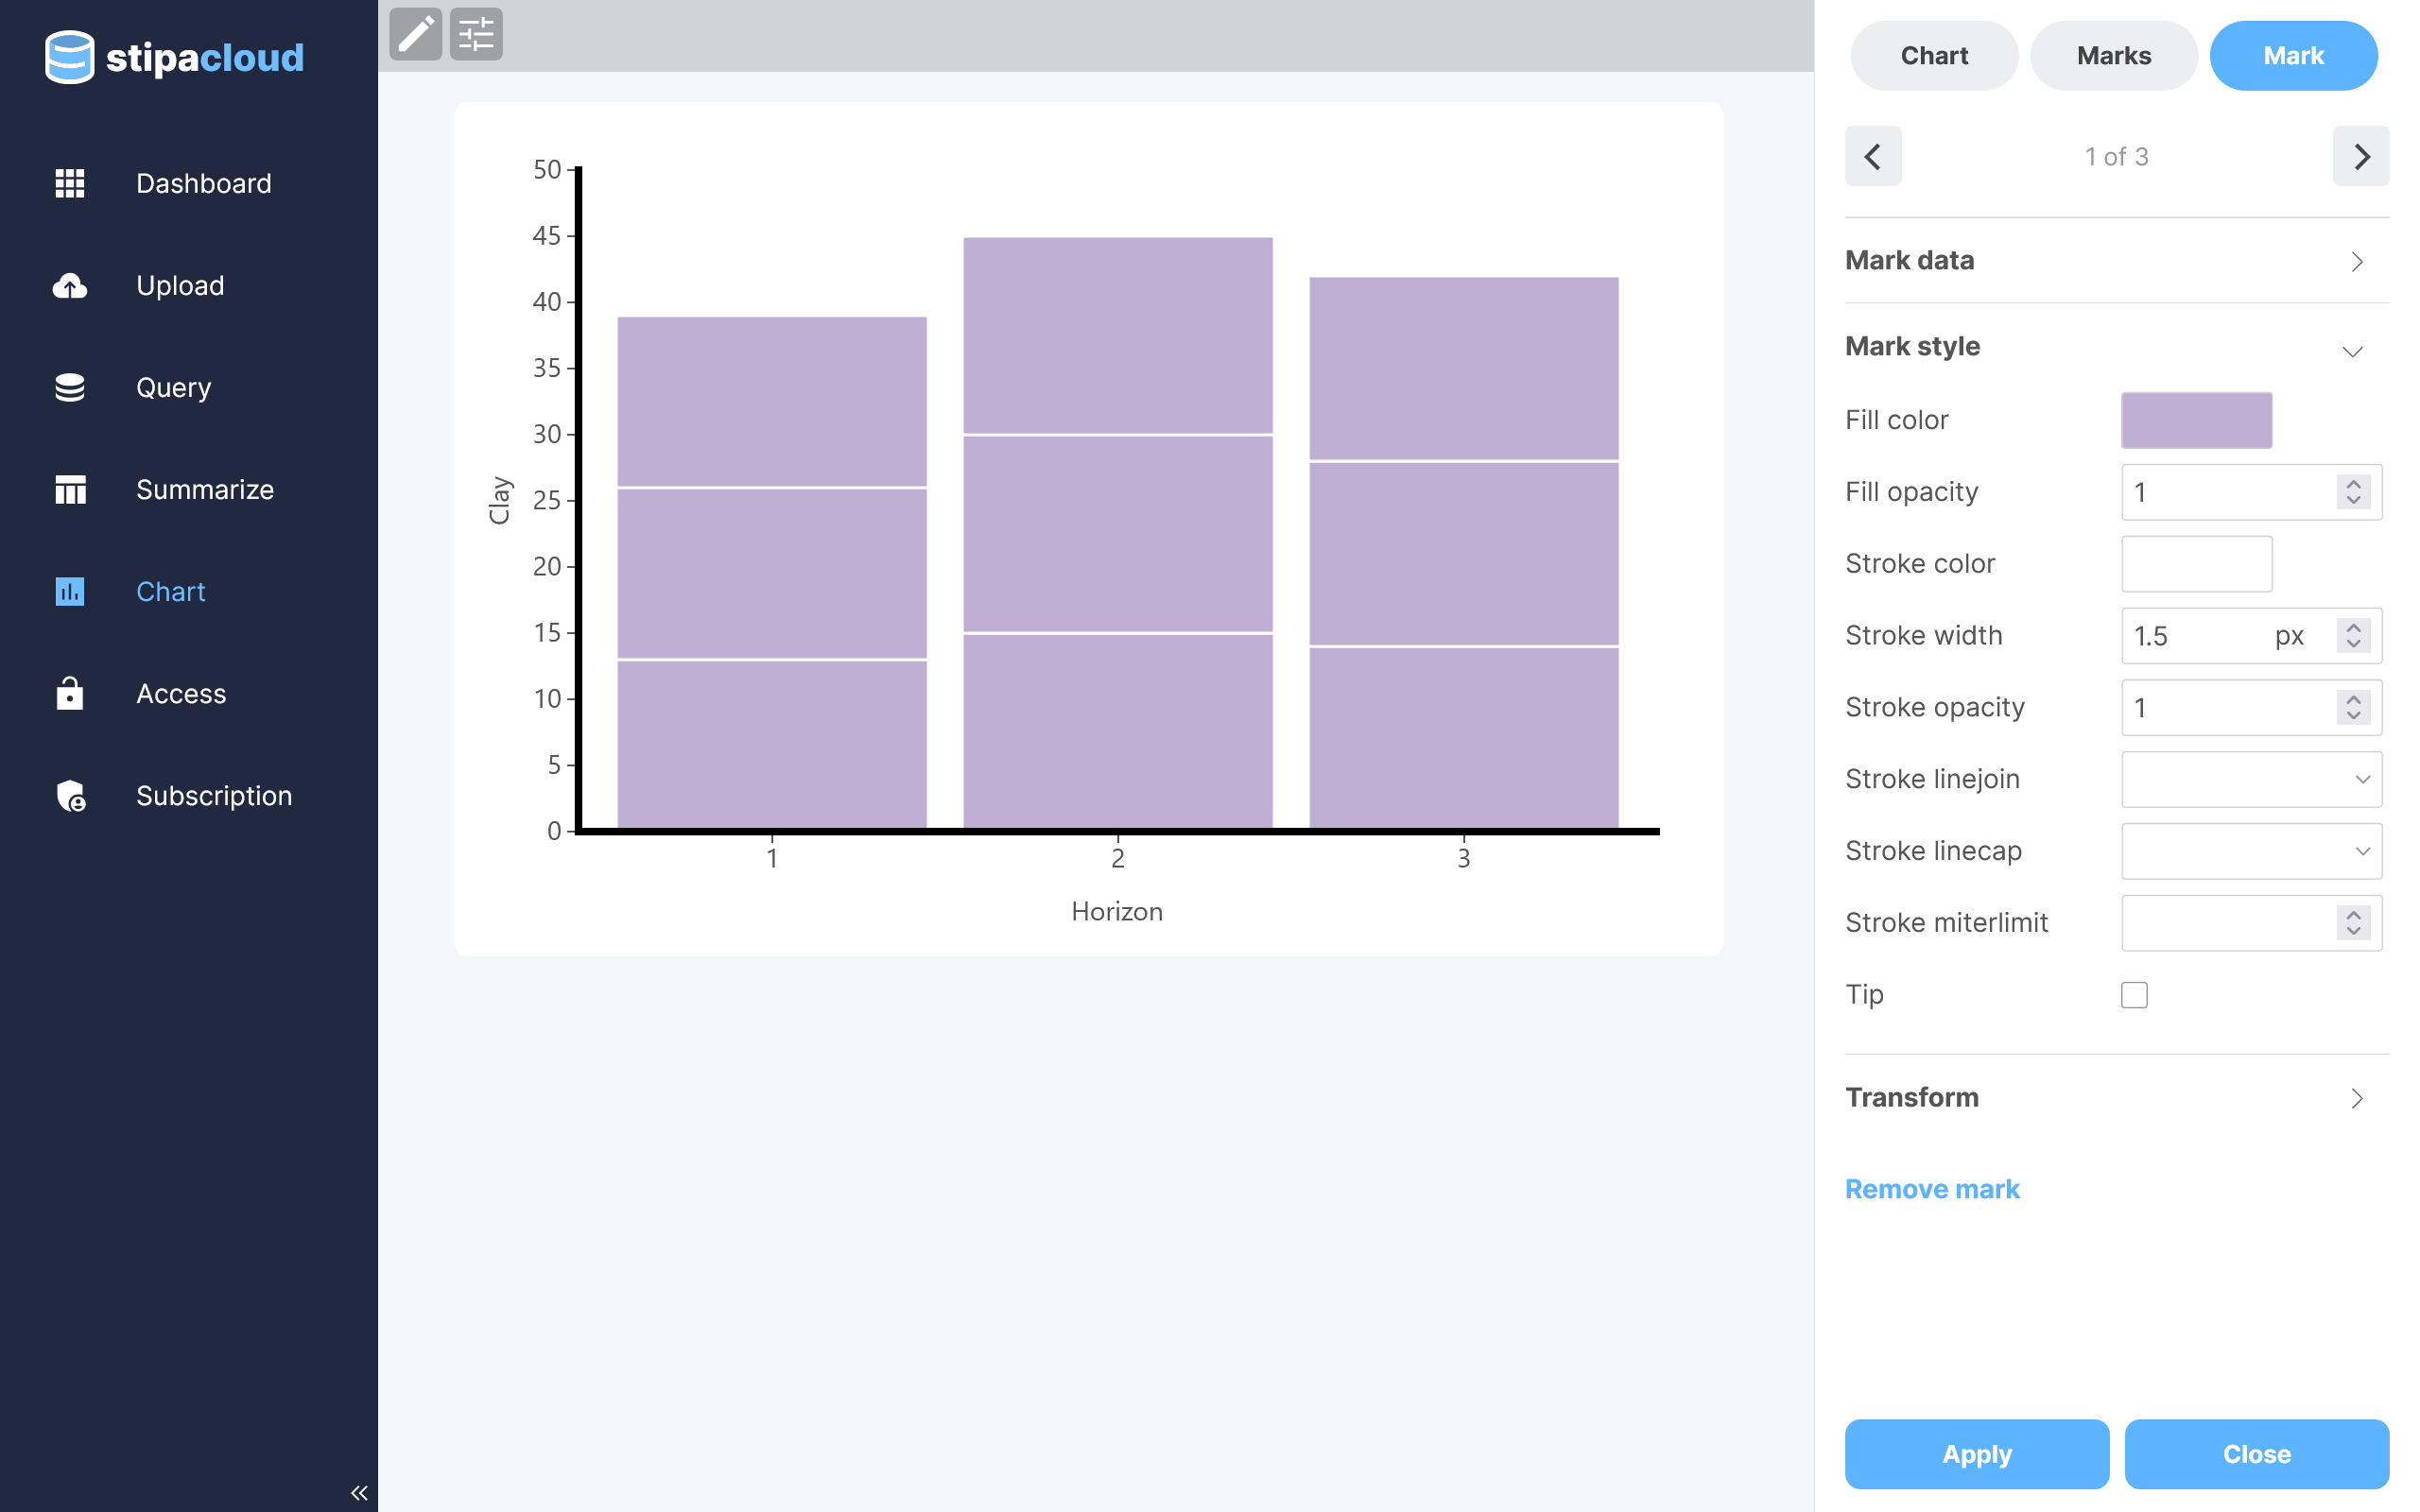
Figure 5. Styling a mark.
Individual marks can also be styled using values from a specified Summary column. Fill color, stroke color, and other styles derived from Summary data will override corresponding styles specified in the Style section.
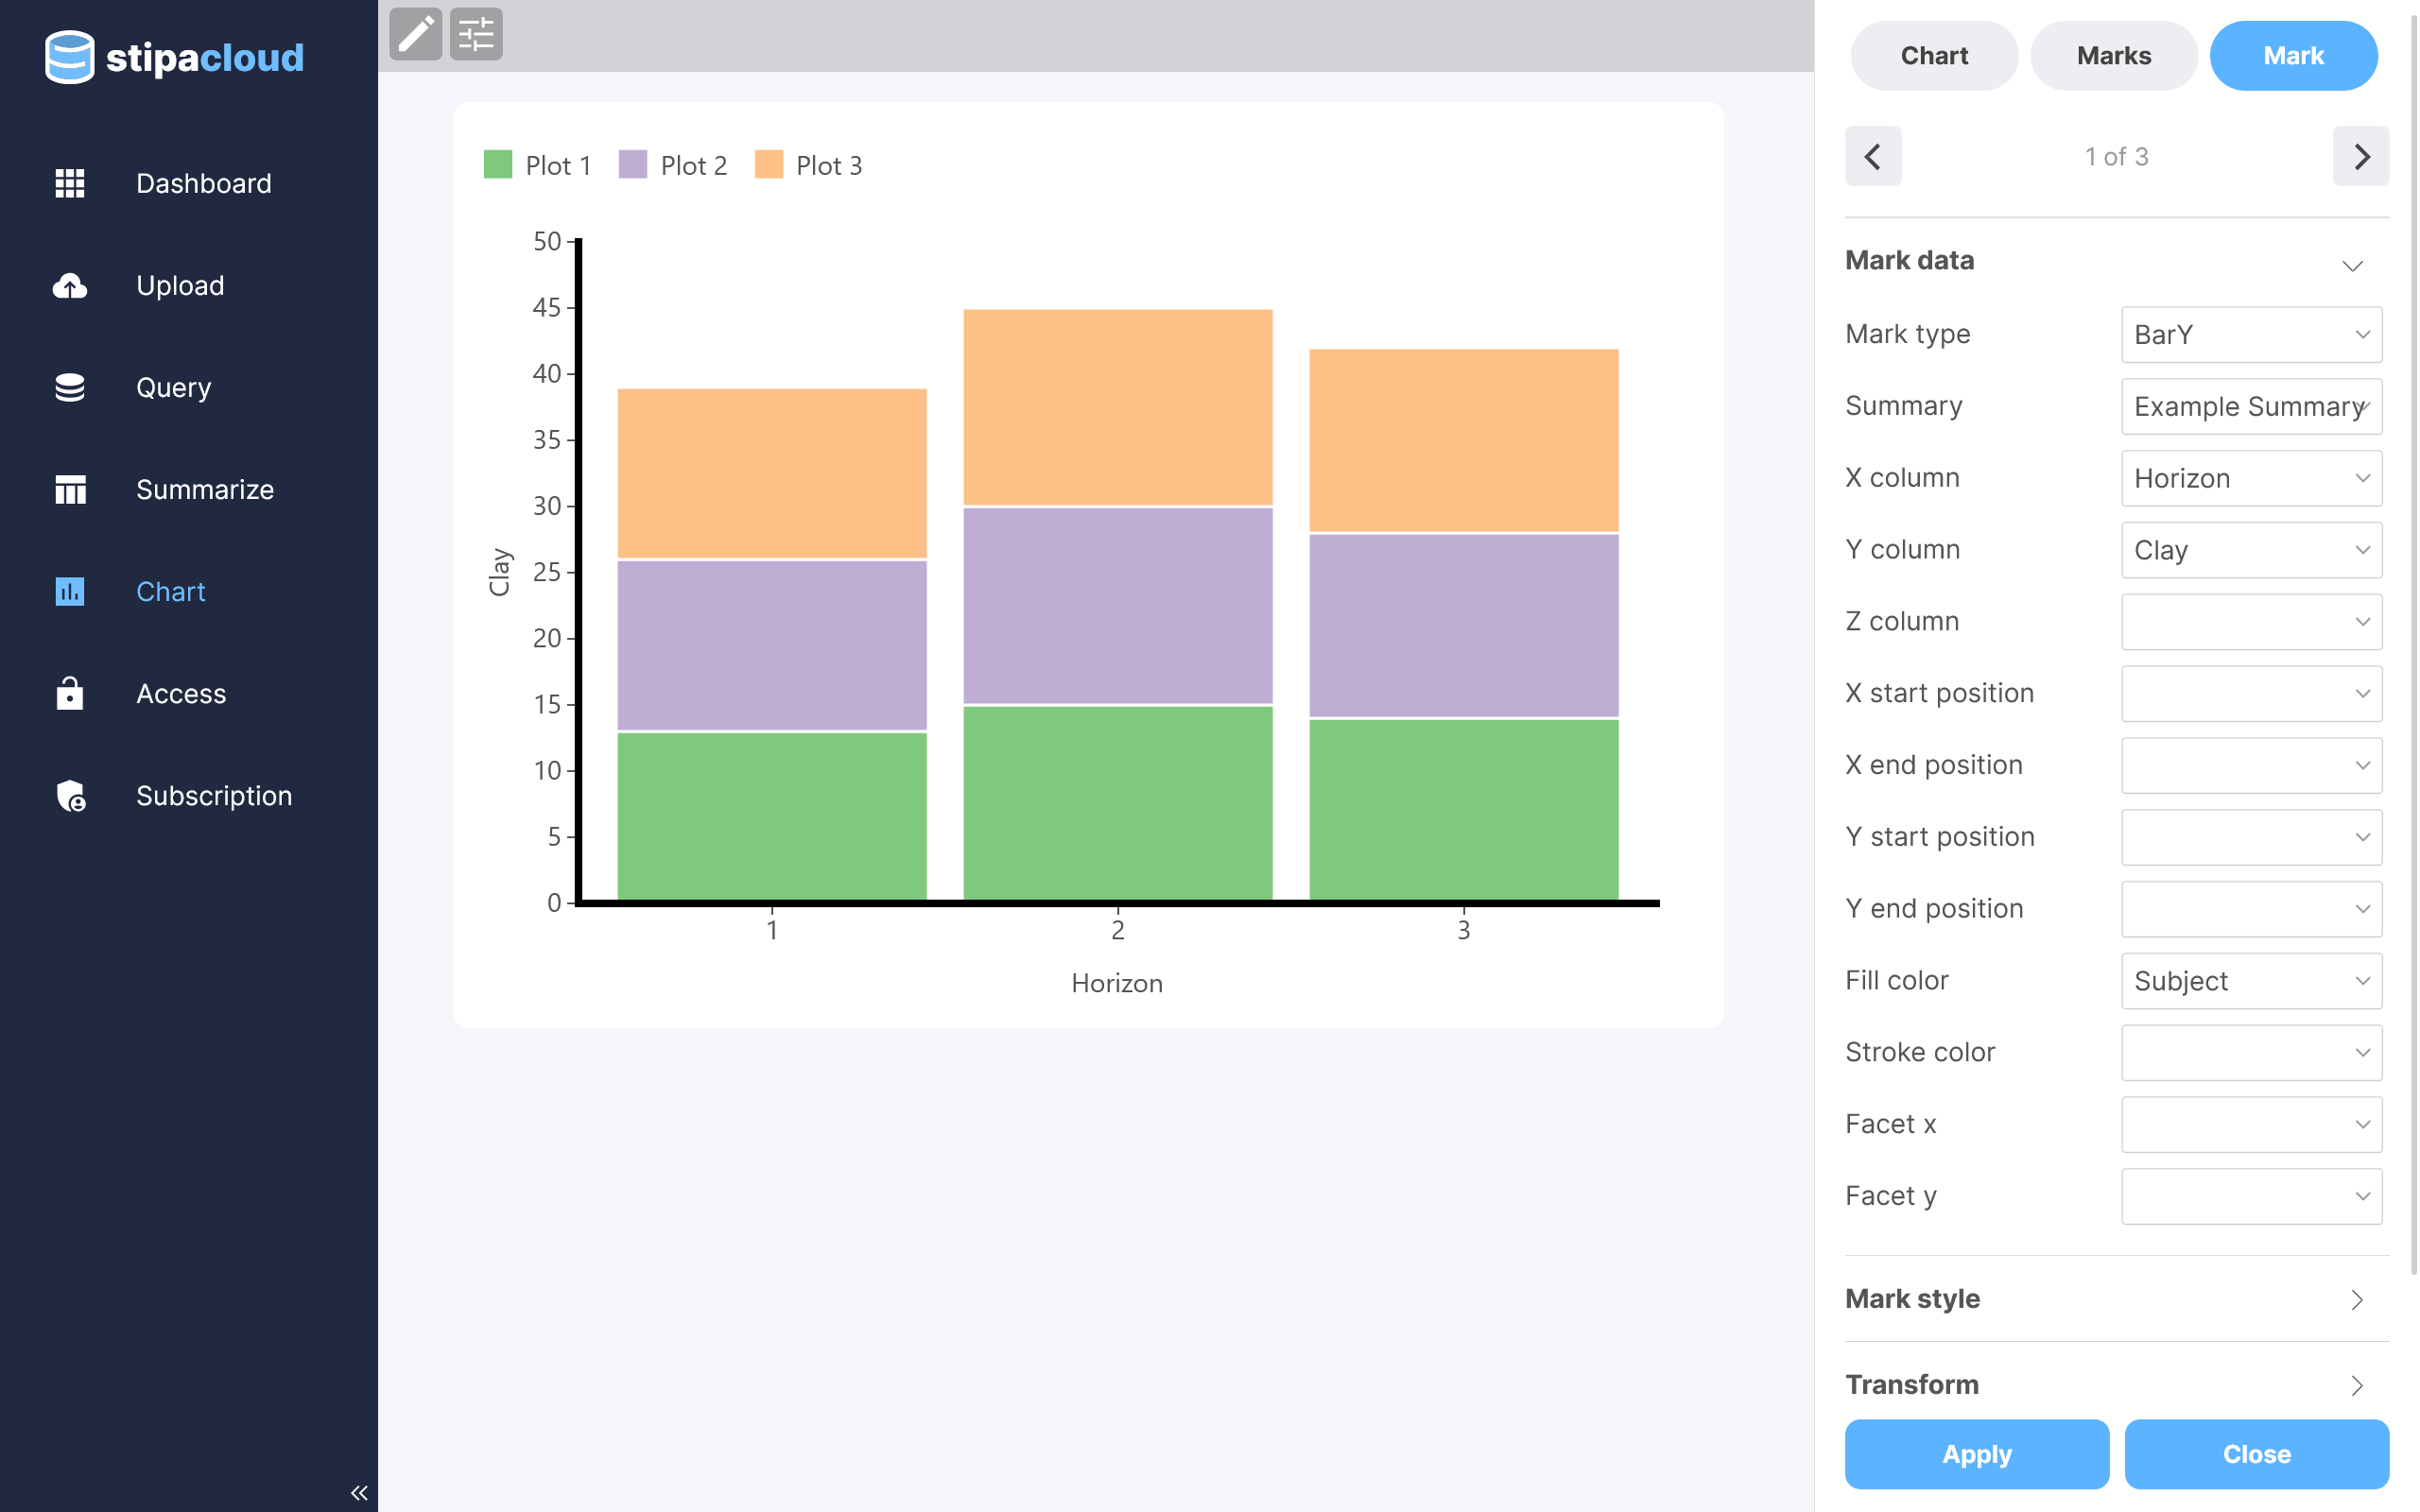
Figure 6. Styling a mark with data.
Select from a variety of color schemes using the Color Scheme section of the Chart panel.
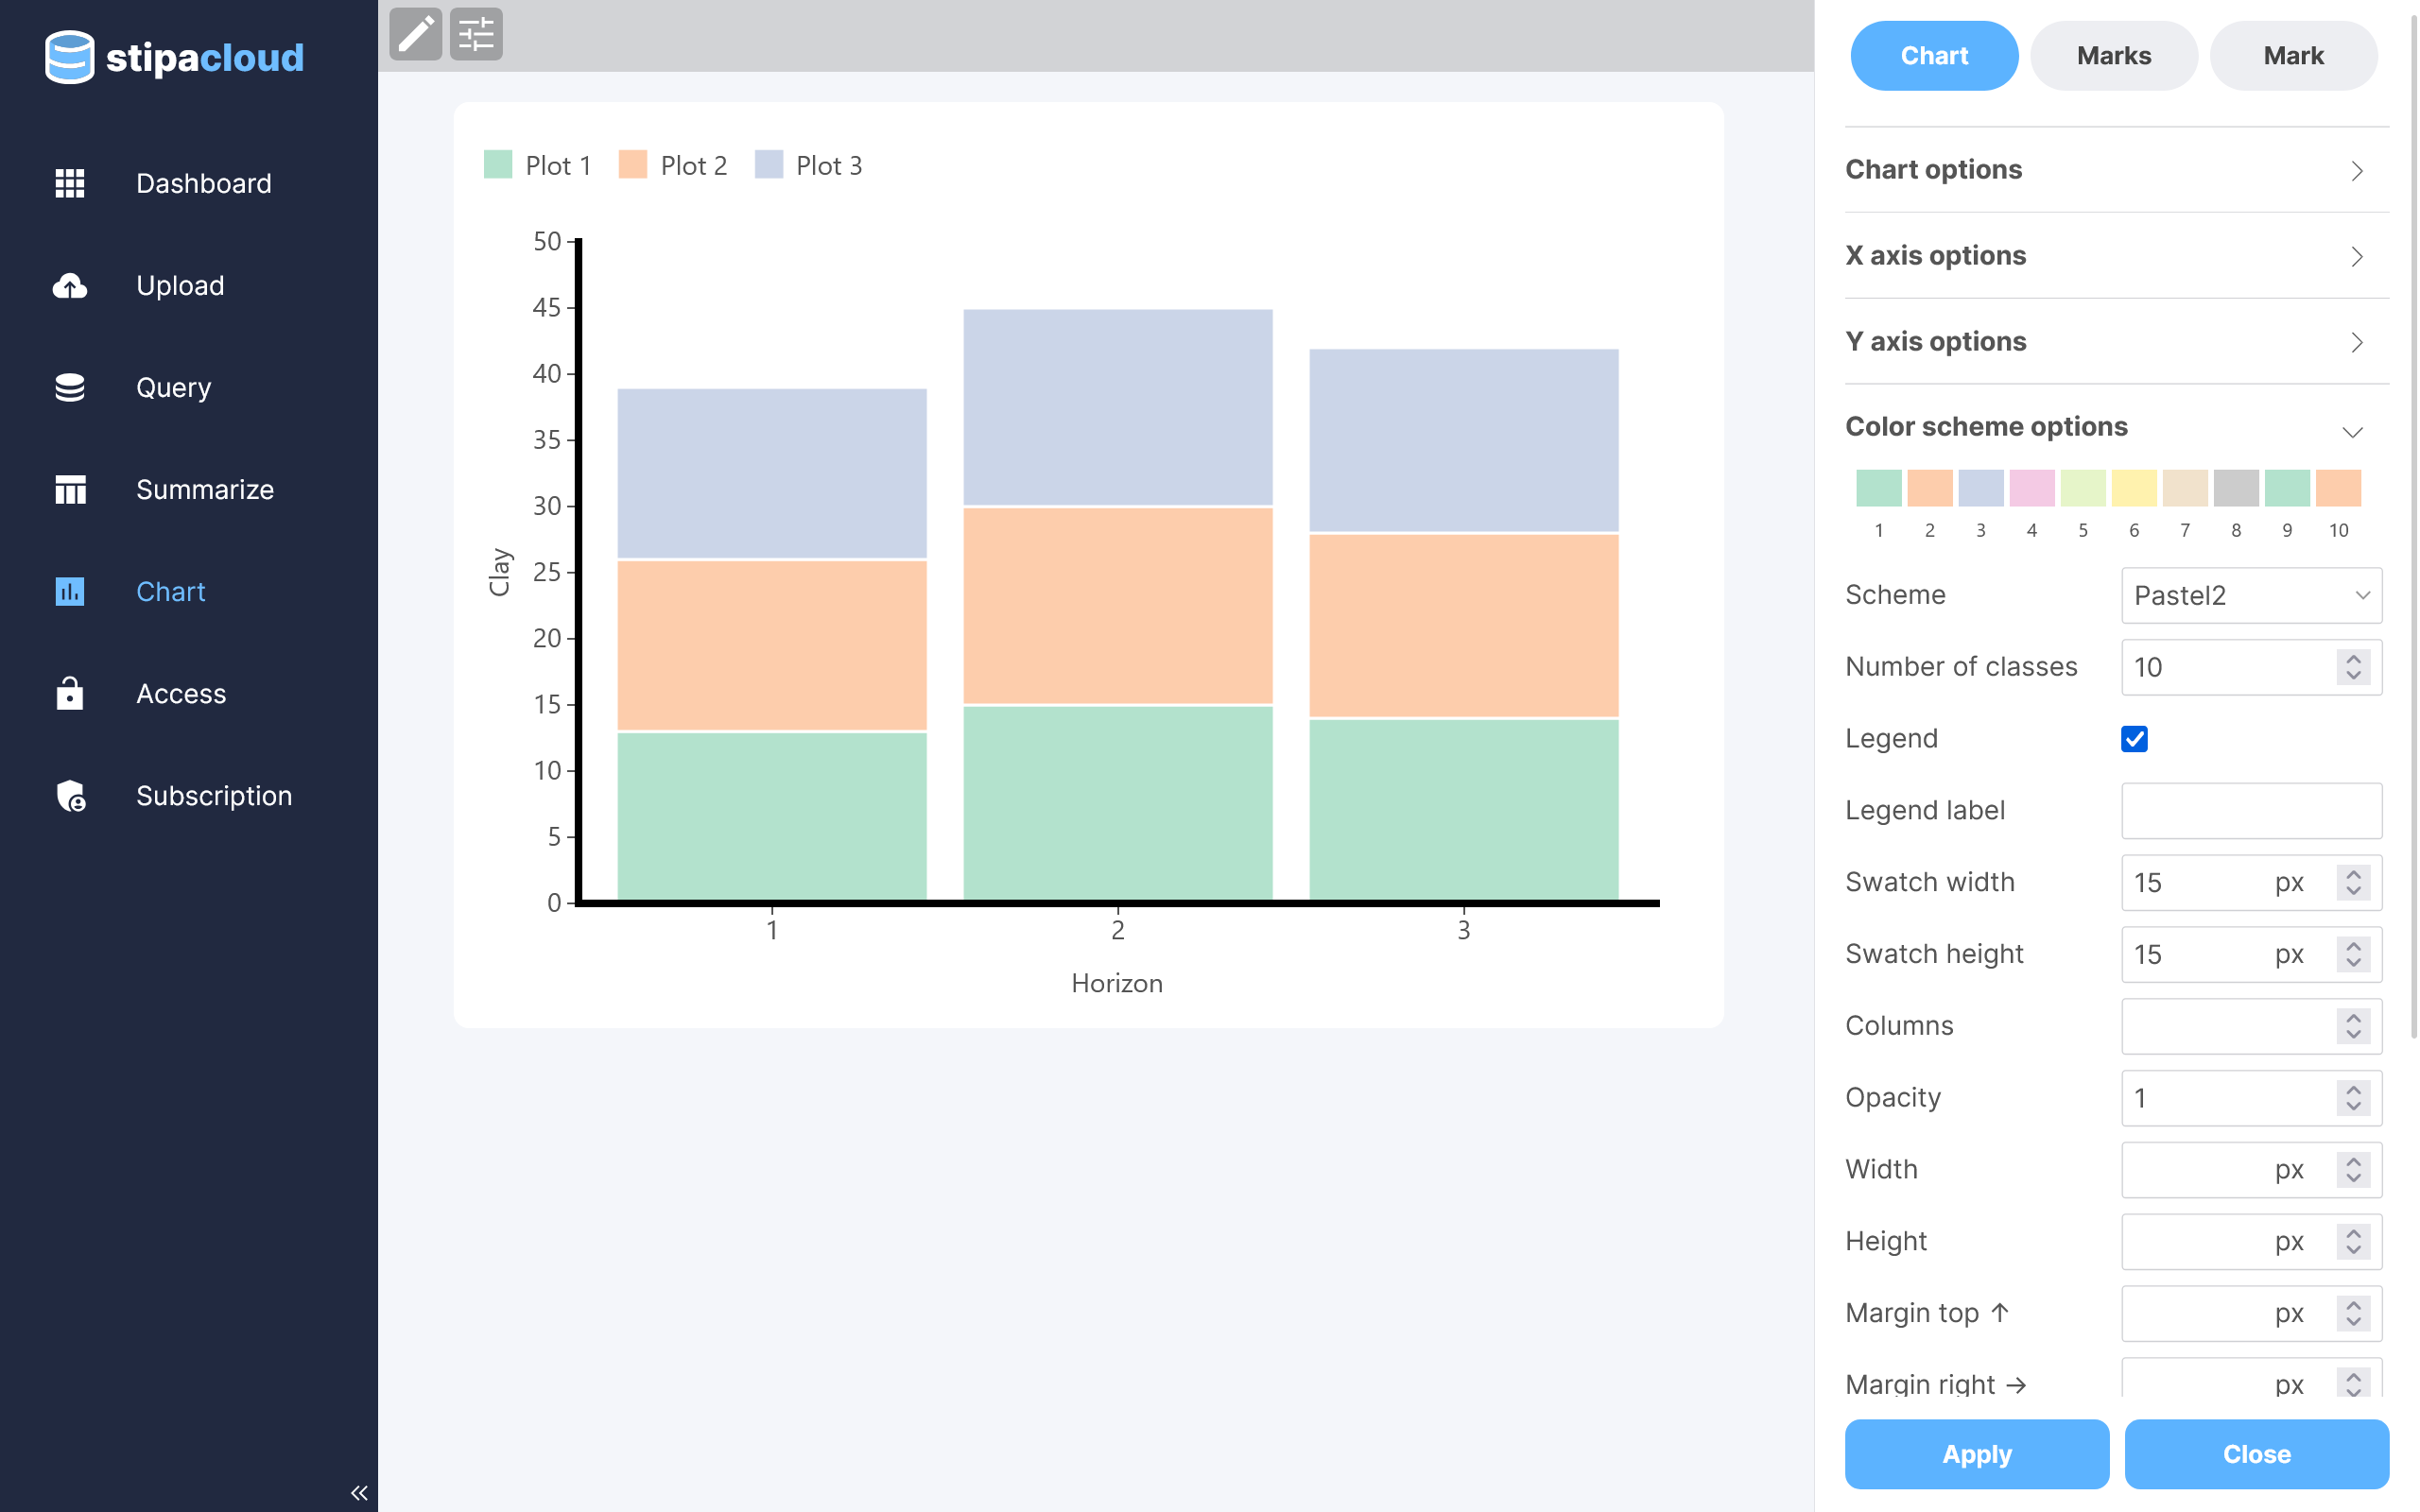
Figure 7. Changing the color scheme.
Sometimes it is useful to visualize subsets of data side by side. For example, you may wish to compare data collected for individual Subjects or Observations. Use the Facet x or Facet y menus, located in the Data section of the Mark panel, to select a Summary column that will be used to subset your data. The mark will be replicated for each data subset.
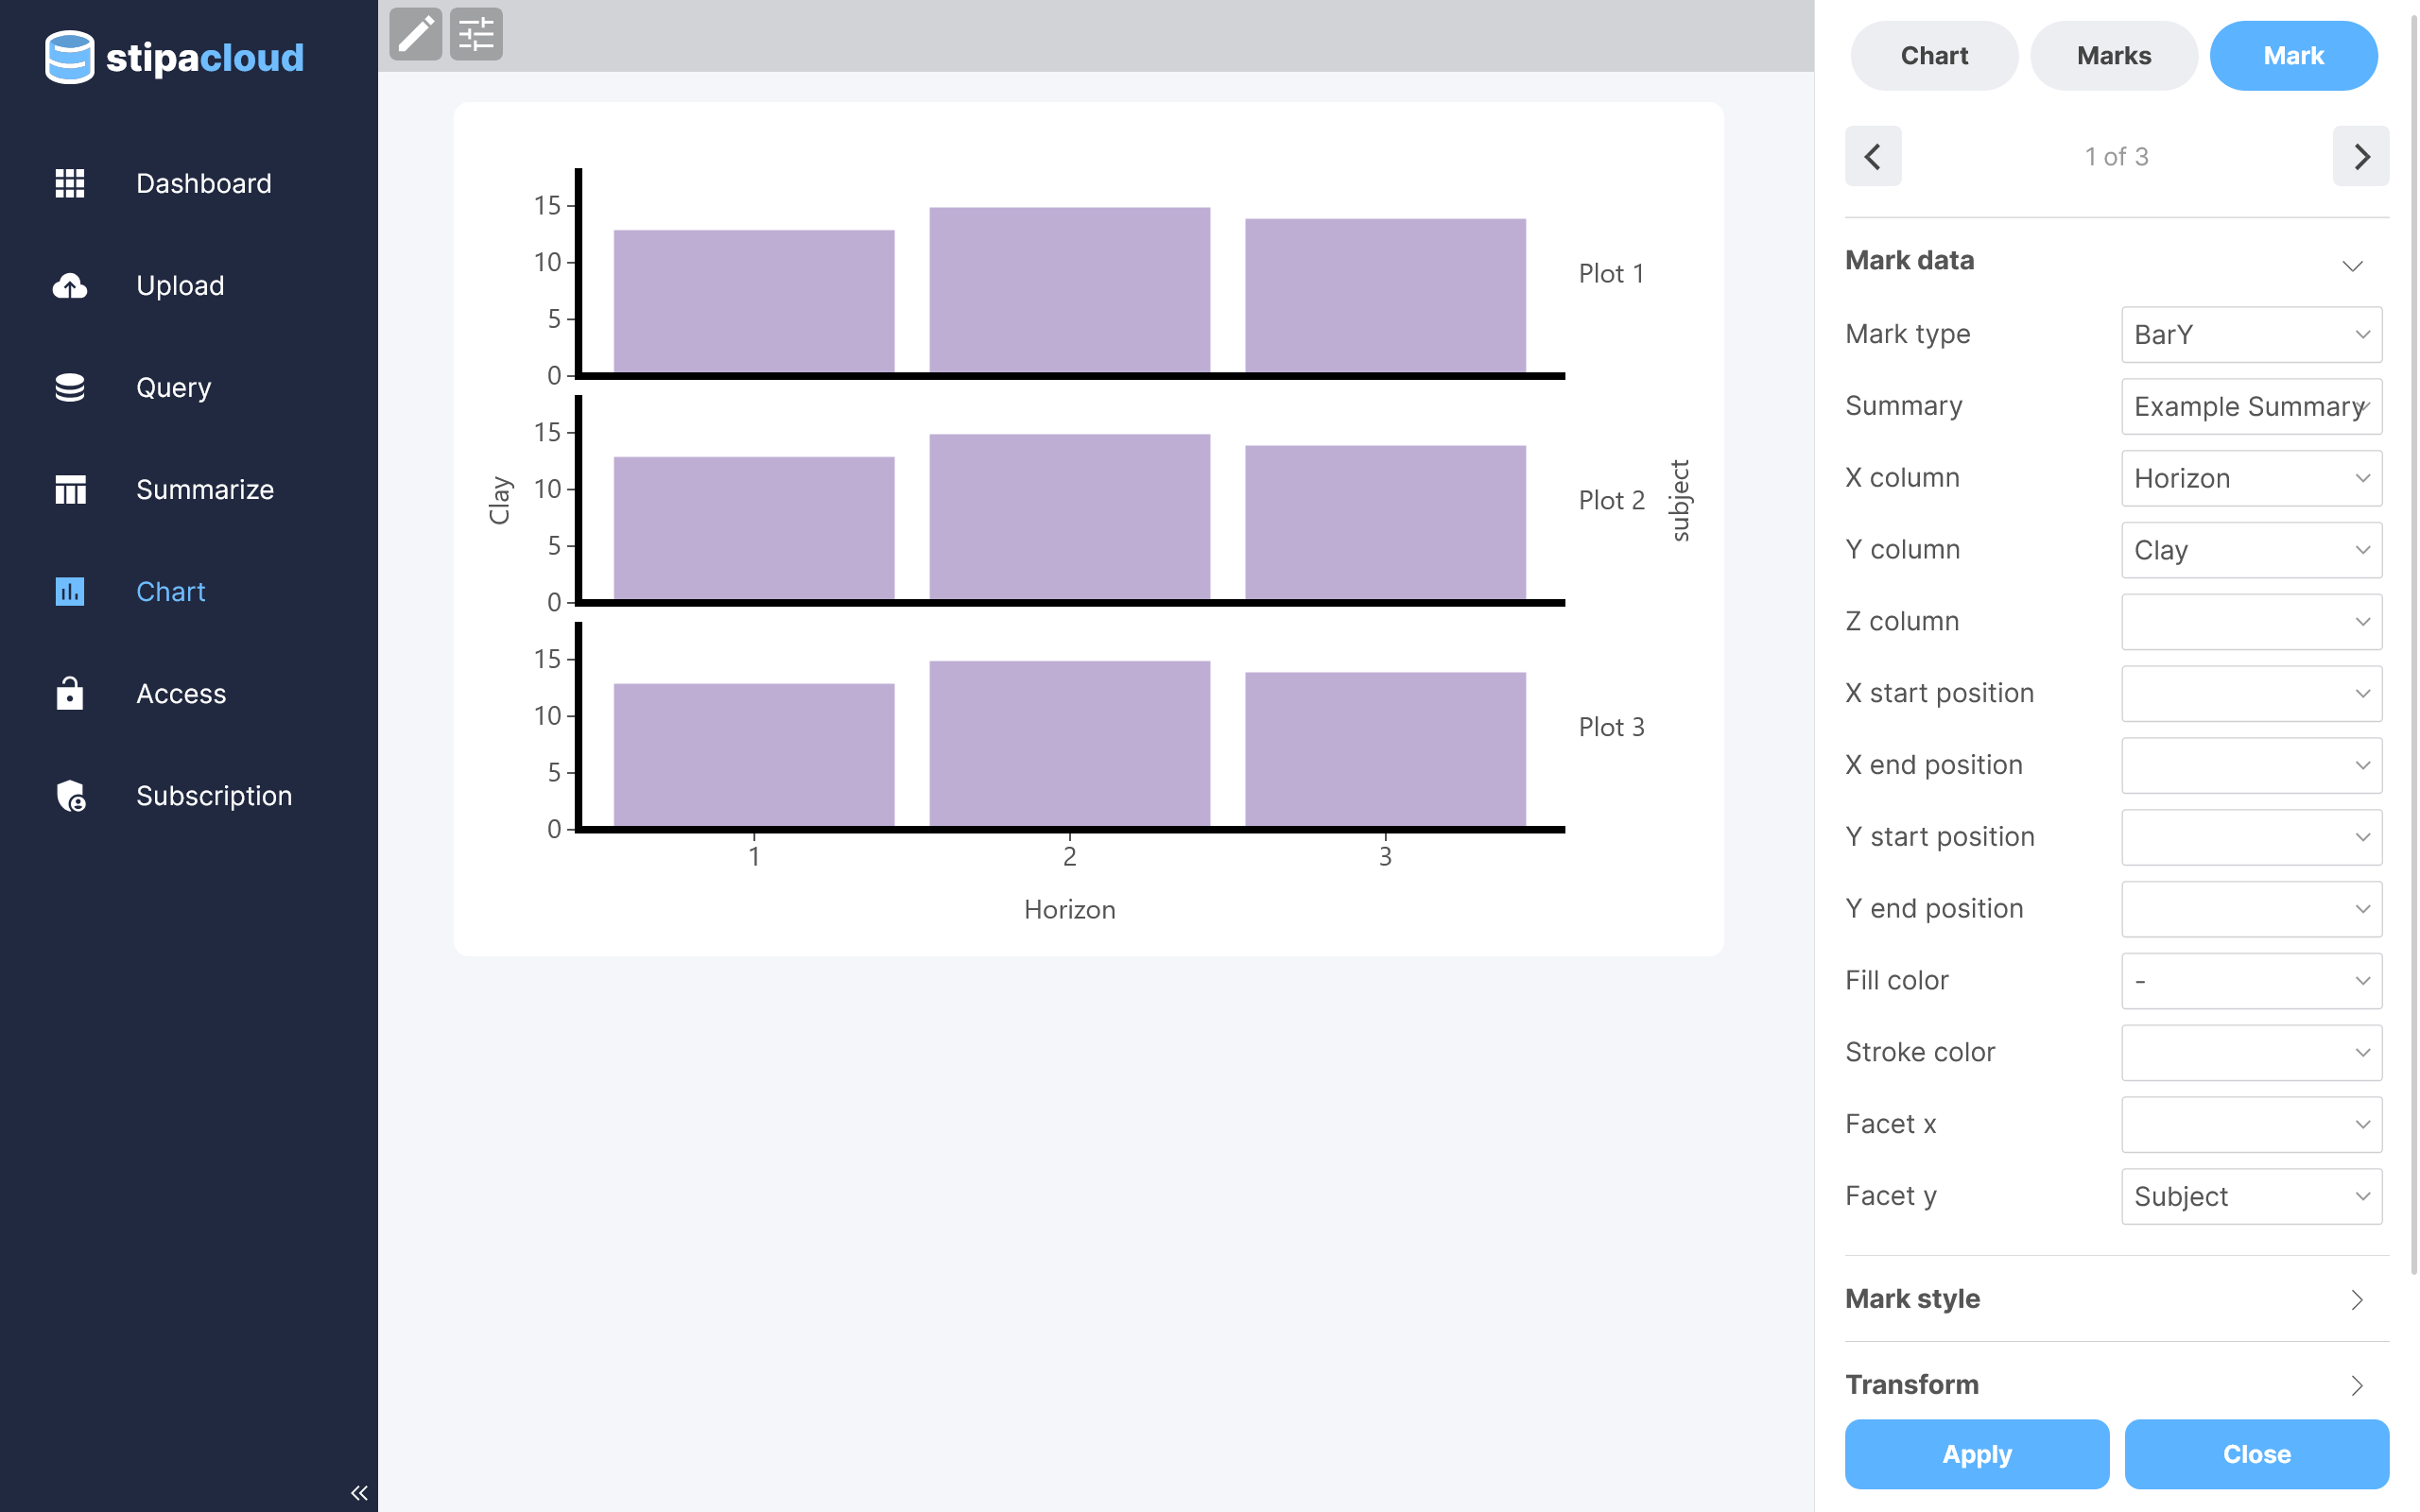
Figure 8. Replicating marks by category.
Tooltips can improve chart interpretation by displaying values when you hover over a chart element. Add tooltips using the Tip checkbox, located in the Style section of the Mark panel.
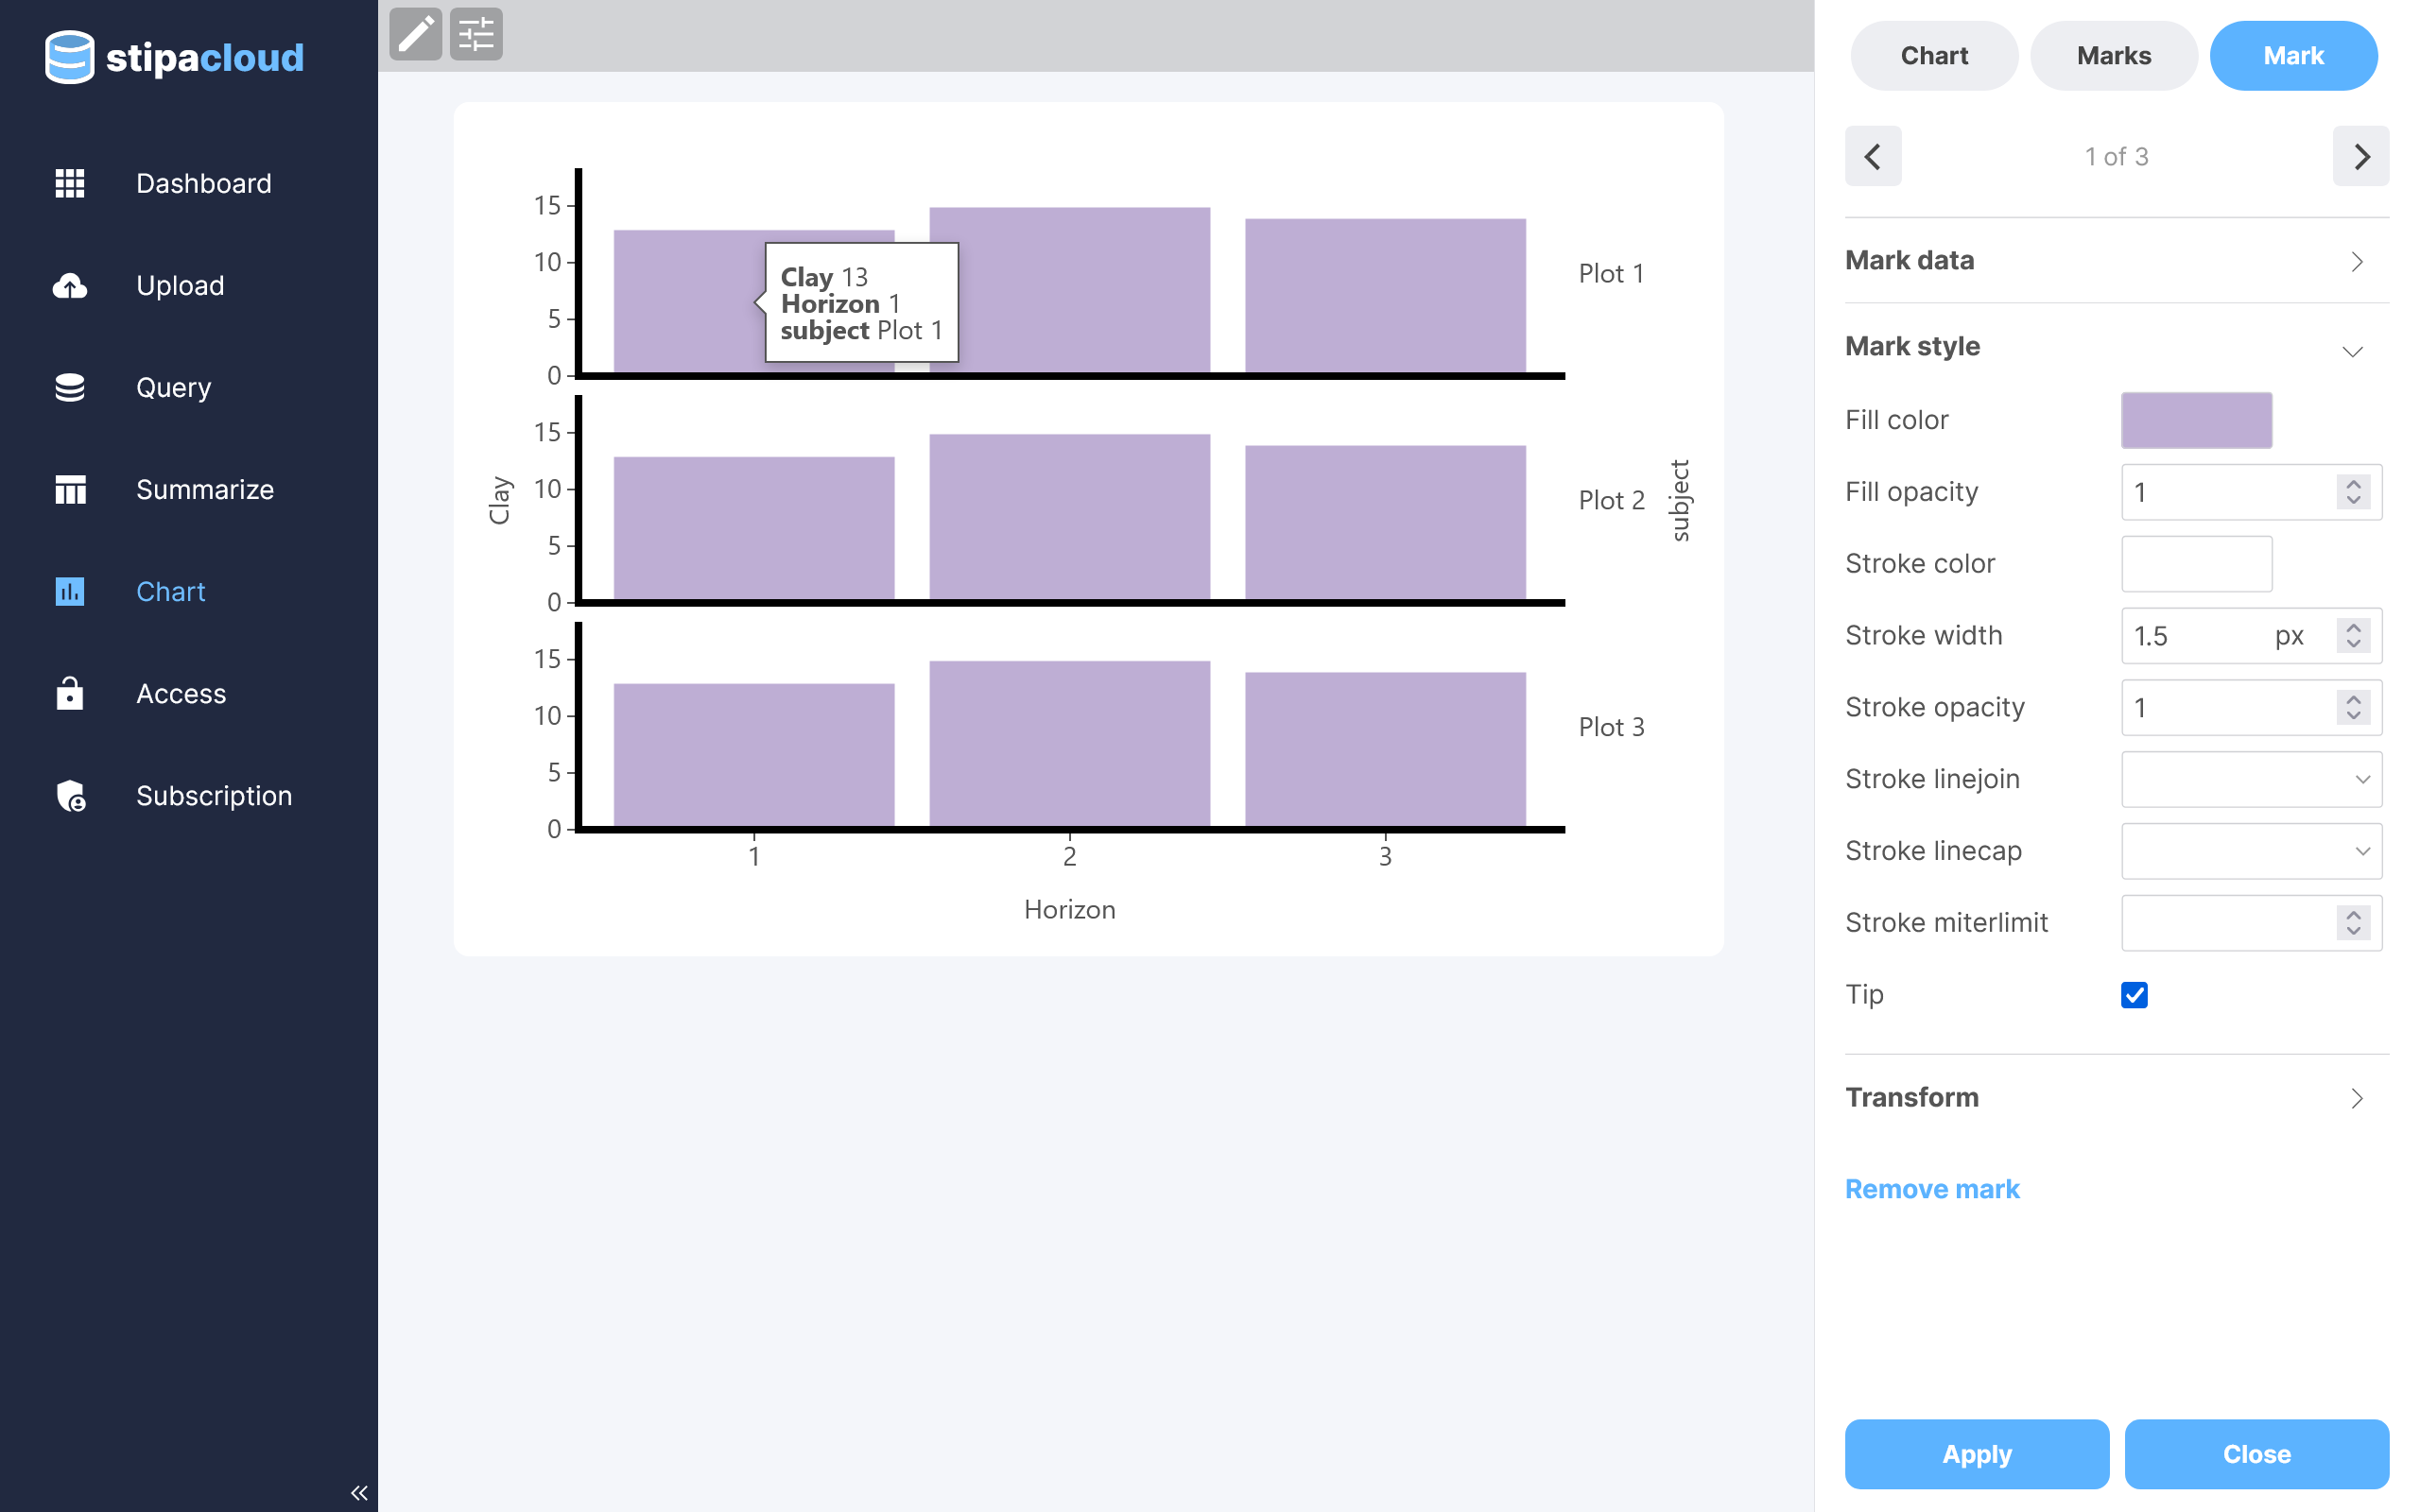
Figure 9. Adding tooltips.
Save a chart using the save buttons in the upper right corner of the view. Any saved chart can be immediately accessed via the Dashboard view. Share, export, or delete a chart using the overflow menu located in the upper right corner of the catalog item.